Dexlab, Author at DexLab Analytics | Big Data Hadoop SAS R Analytics Predictive Modeling & Excel VBA - Page 6 of 18

Visualization with Python Part III: Introducing The Seaborn Library

Visualization with Python Part III: Introducing The Seaborn Library

In this 3rd part of the visualization series using Python programming language, we are going to introduce you to the Seaborn Library. Seaborn is a visualization library which is built on top of Matplotlib library in Python. This library helps us build method based plots which when combined with Matplotlib library methods lets us build flexible graphs.

In this tutorial we will be using tips data, which is a pre-defined dataset in the Seaborn library.

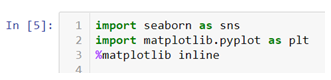
So let’s begin by importing the Seaborn library and giving it a sudo name sns. We will also be importing Matplotlib library to add more attributes to our graphs.

To load the tips data set we will be using .load_dataset() method.

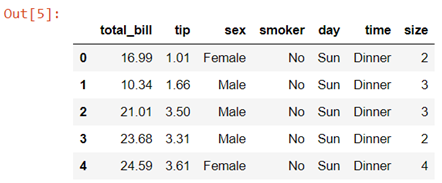
Data description:- This is a dataset of a restaurant which keeps a record of the amount of bill paid by a customer, tip amount over the total bill paid, gender of the customer, whether he or she was a smoker or not, the day on which they ate at the restaurant, what was the time when they ate at the restaurant and the size of the table they booked.

In case while loading the dataset you see a warning box appear on the screen you don’t need to worry , you haven’t done anything wrong. These FutureWarning boxes appear to make you aware that in the future there might be some changes in the library or methods you are using.

You can simply use the .simplefilter() method from the warning library to make them disappear.

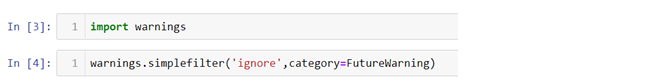
Here the category argument helps you decide which type of warning you want to ignore.

Creating a bar plot in Seaborn

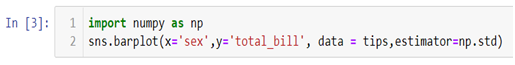
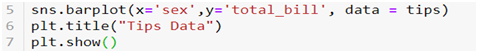
Now let’s quickly go ahead and create a bar plot with the help of .barplot() method.

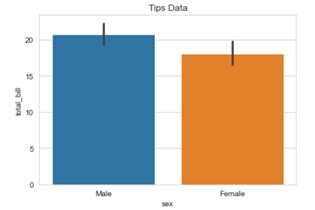
In the above line of code we are using column named sex on the x axis and total_bill on the y axis. But this bar plot is very different from the bar plot which we usually make. The basic concept of a bar plot is to check the frequency but here we are also mentioning the y axis data which in general is not the case with a normal bar plot, that is, we get the frequency on the y axis when we are plotting a bar graph. So what does the above code do?

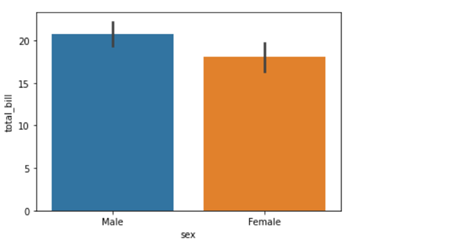
The above code compares the average of the category. In our case the above graph shows that the average bill of male is higher than the average bill of female. In case you want to plot a graph showing the average variation of bill around the mean (Standard deviation) you can use estimator argument within the .barplot() to do so.

Also if you want to change the background of your graph you can easily do so by using .set_style() method.

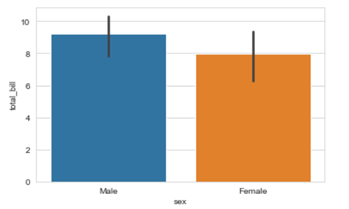
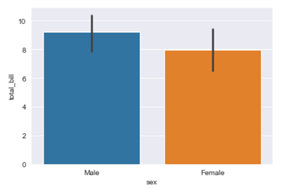
The vertical bars between the graph are called the error bars and they tell you how far from your mean or standard deviation by max data varies.

How to add Matplotlib attributes to your Seaborn graphs

Matplotlib methods can be imported and added to the Seaborn graphs to make them more presentable and flexible. Here we will be adding a title in our graph by using .title() method from the Matplotlib library.

You can use other Matplotlib methods like .legend(),xlabel(),.ylabel() etc,. to add more value to your graphs.

The video tutorial attached below will further help you clarify your ideas regarding the Seaborn library. Follow the series to gain expertise in visualization with Python programming language. Keep on following the Dexlab Analytics blog for reading more informative posts on Python for data science training.


.

An Introduction to Matplotlib Object Oriented Method: Visualization with Python (Part II)

An Introduction to Matplotlib Object Oriented Method: Visualization with Python (Part II)

In the last blog that covered Part 1 of the visualization series using Python programming language, we have learned the basics of the Matplotlib Library. Now that our grasp on the basics is strong we would move further. Let’s break it all down with a more formal introduction of Matplotlib’s Object Oriented API. This means we will instantiate figure objects and then call methods or attributes from that object.

Introduction to the Object Oriented Method

The main idea in using the more formal Object Oriented method is to create figure objects and then just call methods or attributes off of that object. This approach is nicer when dealing with a canvas that has multiple plots on it.

How to make multiple plots using .add_axes()

To begin, we create a figure instance. Then we can add axes to that figure where .figure()is a method which helps us create an empty canvas and then we use .add_axes() method to give the position where the plot is to be made. The positional arguments [left, bottom, width, height] help us decide from where the graph should begin within the canvas and what should be the width and the height of the graph. Since the area of the graph is 100% (1.0), the range of the positional argument should be between 0 and 1 and in case you want to plot the graph half within and half outside the canvas, you can go beyond the specified range depending upon your needs.

Let’s  quickly get to the coding part now.

  • In the above line of codes we are simply importing the Matplotlib library and creating a data which we want to plot.

  • plt.figure()method is helping us create an empty canvas and then we are giving the positional values to the .add_axes() method. As you can see we are using a variable named fig to save our canvas and then using the same variable as an object to add an axes to the canvas. Now all we need to do is use that axes to build are graph by adding x and y data.
  • Now you must be wondering why we aren’t able to see a plot in the corner of the canvas? It is because this procedure works only if we were to build multiple plots. So now let’s see how we can use the .add_axes() method to build multiple plots on top of each other.

  • In the above line of codes we are creating three axes and each axes is smaller than the other so that we are able to plot multiple graphs on top of each other.

  • Here we are making three different graphs and each graph has its own title and x axis and y axis labels. But to add title and axis labels we are now using .set_title(), .set_xlabel(), and .set_ylabel() instead of .title(), .xlabel() and .ylabel(). In axes2.plot() we are also using RGB color instead of using the predefined color in .plot() method. You can use your favorite color too by simply typing RGB color picker in your Google search and copy pasting the color code in the .plot() method. After running the above code we get the following graph:-

How to make multiple plots using .subplots()

.subplots() method is similar to the previous .subplot() method, the only difference is that now we use it on a canvas.

  • In the .subplots() we do not mention the plot number instead we use plot indexing method to build graph.

  • As you can see we are accessing the index number to build our plot and then using .tight_layout() method to keep the graphs from overlapping. After running the above code we get the following graphs:-

Do not forget to check out the video tutorial attached below to learn how this method works. Keep following the series to upgrade your skills and to explore more informative posts on topics like Python Programming training you need to follow the Dexlab Analytics blog.


.

A Quick Guide To Predictive Analytics

A Quick Guide To Predictive Analytics

Ever since the world woke up to discover the significance of data, there has been tremendous advancement in this field each taking us further towards the utilization of accumulated data to achieve a higher level of efficiency. Predictive analytics is all about extracting hidden information in data and combining technologies like machine learning, artificial intelligence, data analysis, statistical modeling to predict future trends.

Sifting through stored datasets comprising structured and unstructured data, predictive analytics identifies the patterns hidden and analyzes those patterns to make predictions about trends and thereby helps to identify opportunities as well as risk factors. Not just forecasting, but predictive analytics also helps you find associations that could lead you to a new breakthrough. Having undergone big data training in gurgaon, could actually prove to be a big boost for someone planning on working in this specialized field. Now, when you have access to data-based forecasting, it is easy for you to identify both negative and positive trends and in turn, it helps you take the right decisions.

Businesses especially rely heavily on predictive analytics for market analysis, targeting their customers, and assessing risk factors. Unlike before when these business strategies were based on mere guesswork, now the think-tank has access to data to anticipate an outcome.

Predictive analytics models: Predictive analytics models could be classified into two broad categories as follows

Classification models: In this model data is categorized on the basis of some specified criterion. 

Regression models: Regression models focus on identifying patterns that already exist, or, that has been continuing for a while.

So, what are the processes involved in Predictive analytics?

Predictive analytics process could be broken down to different stages and let’s take a look at what the steps are

Defining the Project: This is the first stage when you decide what kind of outcome you are expecting. Besides setting out clear business objectives you also need to be clear about the deliverables as these will have a bearing on your data collection.

Collecting all Data: This is the second stage where data from different sources are collected.

Analyzing Data: In this stage, the data collected is cleaned and gets structured and also gets transformed and modeled.

Statistics: A statistical model is used to test the assumptions, hypotheses, as well as findings.

Modeling: Through multi-model evaluation best option is chosen from an array of available options.  So, the idea is to create an accurate predictive model.

Deployment: This is the stage of deploying the predictive model and create an option for deploying the results for productive purposes in reality.

monitoring: the final and an important stage where the models created are monitored and tested with new data sets to check whether the models still have relevance.

The applications of predictive analytics

Predictive analytics models have found usage across industries

  • In the financial sector, predictive analytics could be used for credit risk measurement, detecting fraud as well as for minimizing the risk, and also for retaining customers.
  • In the field of healthcare predictive analytics could be used for detecting severe health complications that might develop in a patient in the future.
  • In business predictive analytics could be used for short-term or, long-term sales forecasting. In fact, the reaction of the customer could be anticipated and changes could be made accordingly.
  • When a huge investment is involved predictive analytics could help to identify the problematic areas that could pose risk. Accurate risk assessment could help a company secure a better ROI.
  • Predictive analytics could help companies with their customer service, marketing campaigns, sales goals. Companies can strategize better to retain customers and improve their relations with them.
  • With predictive analytics in place, it would be easier to predict equipment maintenance needs and it could also be used for forecasting an equipment failure.

Data Science Machine Learning Certification

Predictive analytics is being adopted in a number of industries ranging from insurance to healthcare. The forecasting that one gets is highly accurate. However, building a reliable dataset and building a reliable model is essential. Having trained personnel on the team who have done data analyst course in delhi, could be helpful.


.

A Quick Guide To Using Matplotlib Library (Part I)

A Quick Guide To Using Matplotlib Library

Matplotlib is the “grandfather” library of data visualization with Python. It was created by John Hunter. He created it to try replicating MatLab’s (another programming language) plotting capabilities in Python. So, if you are already familiar with matlab, matplotlib will feel natural to you.

This library gives you the flexibility to plot the graphs the way you want. You can start with a blank canvas and plot the graph on that canvas wherever you want. You can make multiple plots on top of each other, change the line type, change the line color using predefined colors or hex codes, line width etc.

Data Science Machine Learning Certification

Installation

Before you begin you’ll need to install matplotlib first by using the following code:-

There are two ways in which you can built matplotlib graphs:-

  • Method based graphs
  • Object-oriented graphs

Method Based Graphs in Matplotlib:-

There are pre-defined methods in matplotlib library which you can use to  create graphs directly using python language for example:-

Where, import matplotlib.pyplot as plt this code is used to import the library, %matplotlib inline is used to keep the plot within the parameters of the jupyter notebook, import numpy as np and x = np.array([1,3,4,6,8,10]) is used to import the numpy (numerical python) library and create an array x and plt.plot(x) is used to plot the distribution of the x variable.

We can also use .xlabel(), .ylabel() and .title() methods print x axis and y axis labels and title on the graph.

If you want to add text within your graph you can either use .annotate() method or .text() method.

Creating Multiplots

You can also create multiple plots by using .subplot() method by mentioning the number of rows and columns in which you want your graphs to be plotted. It works similar to the way you mention the number of rows and columns in a matrix.

You can add title, axis labels, texts etc., on each plot separately. In the end you can add .tight_layout() to solve the problem of overlapping of the graphs and to make the labels and scales visible.

Check out the video attached below to get an in-depth understanding of how Matplotlib works. This is a part of a visualization series using Python programming language. So, stay tuned for more updates. You can discover more such informative posts on the Dexlab Analytics blog.


.

AI Is Redefining Mobile App Technology

AI Is Redefining Mobile App Technology

Gone are the initial days of mobiles that weighed like brick. Over the last decade, mobile phones have re-emerged as Smartphones which are reshaping our lives. Whether the way we stay connected, or, carry out tasks or, say even choose to entertain ourselves, the smart devices are changing the way we function.

Today’s Smartphones are loaded with apps designed to make life hassle-free and fun for us. From gaming apps to fitness apps to shopping apps, we have apps for everything. AI technology that is now seeping through every pore of our existence is impacting the way mobile apps are made and their perfect confluence is making us hopeful for a smarter future. App developers might consider updating themselves with artificial intelligence course in delhi, to stay ahead in the game.

The leading smartphone manufacturers such as Huawei,  Apple, are implementing AI, machine learning technology in the phones to make this device future-ready.  The built-in AI in Smartphones is indeed changing the ways these smart devices function. So, how exactly AI is making the impact on mobile app technology and to which effect?

Smart cameras

Who needs to invest in a DSLR, when you have all the features necessary packed into your Smartphone camera? With smart filtering, picture enhancement capabilities being available thanks to smart AI algorithms, all you need is your phone to click that perfect shot. It no longer matters whether you are taking photos in the dark, or, the background of your subject is chaotic or, completely hideous. The smart editing features would transform your images in no time.

Smart search

Using your Smartphone to conduct a quick search on Google is something you probably do without even giving the process a single thought. Technology has advanced to a degree thanks to AI, that now instead of putting in a text query or, a voice query, you can move straight to visual search. This enhances your search experience, as sometimes you might not know the exact search term, and visual search can be a great aid for you.

Smart translations

Just imagine having Baidu on your phone, the search engine that does translation in real-time, so, having an app on your phone that does the same can be a life-changing experience for you. The available apps do the translation job well but, they do require you to have a continuous internet connection. With AI algorithms taking things further, these translations can be done in real-time without the obligation of having access to the internet.

Smart facial unlocking

 As soon as Apple introduced the world to its revolutionary face unlock feature, the other giants entered the race to make this feature available to their users. They have done a great job too, now a good Smartphone has the smart face unlock feature and this technology is an AI miracle that we are taking advantage of. Image recognition technology is moving fast and advanced research work is going to push it to another level. Now there are hand-free gestures available.  The algorithms are now smart enough to recognize a face even if its appearance has changed. Users can expect nothing but, a smooth face unlock feature that keeps their device secure.

Data Science Machine Learning Certification

Smart authentication

The availability of Smartphones is leading us to execute all our tasks using the device. From mobile banking to shopping all financial activities are being conducted online, the phone also contains valuable data that is vulnerable. AI algorithms can secure the device and keep the hackers and cyber crimes at bay while keeping the user data safe. Biometric authentication reaches a new level with AI, keeping the security threats away while staying user friendly.

The future of mobile apps looks brighter as AI-enabled solutions make data security a priority while making the apps more convenient and versatile. There is a already a big demand for professionals who are proficient in AI technology, so approaching a deep learning for computer vision training center in Delhi NCR, would be a timely move for an aspiring developer.


.

AI is Changing The Rules of The Gaming Industry

AI is Changing The Rules of The Gaming Industry

The world of gaming has many tricks up its sleeves to lure avid gamers into spending hours in a virtual world that challenges their skill and intellect to overcome cleverly devised obstacles.  The high a gamer experiences crossing multiple levels and unlocking ‘achievements’ is incomparable. Game developers spend hours brainstorming ways to create simulations that get as real as possible. AI, the groundbreaking technology that has its core in simulating human intelligence, is no doubt should be the most sought after solution the gaming industry needs to revolutionize the gaming experience across multiple platforms.

 AI integration in gaming: What to expect?

Powerful visuals

One of the core elements of great gaming experience has to be the visuals, games that have appealing visuals and great simulation draw more gamers. the design team keeps on working on graphics to improve the visual quality. AI integration could be a great savior here as, it can learn from the data and could predict the expectation of the gamers and come up with game environments, characters that are as close to reality as possible. The smart algorithms could effortlessly simulate human movement and expression by observing them in reality and thereby create better virtual characters and environment. The designing process could take less time as the entire process could be automated, but developers should have a background in deep learning for computer vision course to create the ultimate magic.

Smarter gaming experience

The game developers relentlessly try to create a smart experience for the gamers, a feat they could easily achieve by implementing AI technology. By enabling voice and sound recognition, pattern recognition the games can be more futuristic. With reinforcement learning, the game characters would be able to evolve on their own as they would be learning from their own actions and later they would modify themselves without any intervention.

Enhanced gaming experience

When it comes to games there are plenty of options available in any genre of gaming. However, gamers prefer those games that offer a complete package of experience including attractive visuals, engaging ambiance, interactive features. All of these could be achieved with AI and furthermore, the customization of the game being played could also be done in real-time thus enabling the player to get a completely immersive experience. The integration of AI certainly can make things more intuitive.

Realistic games

The initial stages of gaming visuals and the awe that it evoked have become a thing of the past. Today game developers can take things into a futuristic world with just one twist of AI. Indeed the augmented reality is now a part of the gaming experience that no gamer wants to miss out on.  The game developers are applying 3D visualization, simulation with keen detailing as the gamers now crave for life-like ambiance. Furthermore, the games are now sharper and could respond to the moves being made by the gamer in real-time.

Data Science Machine Learning Certification

Games on your devices get an edge

Even though gaming is a universally loved and shared phenomenon, not everybody has access to cool gaming consoles. Smart devices that we have like our mobiles and tablets are the devices that are probably more used for playing multiple games. However, those who have played across both platforms would agree to the fact that mobile gaming is not the same. There are some limitations and smart AI algorithms are now being applied to address those specific issues and design games that are not only visually appealing but also interactive in nature.

The gaming industry is moving at a fast pace with AI technology, the merger is beneficial and promises a brilliant gaming experience for future gamers. Building a career in this field is a great idea and if you could upgrade yourself with a course like artificial intelligence certification in delhi ncr, then the sky is your limit.


.

Data Warehouse: Concept and Benefits

Data Warehouse: Concept and Benefits

A business organization has to deal with a massive amount of data streaming from myriad sources, and data warehousing refers to the process of collection and storage of that data that needs to be analyzed to glean valuable business insight.  Data warehousing plays a crucial role in business intelligence. The concept originated in the 1980s, it basically involves data extraction from disparate sources which later gets processed and post formatting the data stays in the system ready to be utilized for taking important decisions.

Data warehouse basically performs the task of running an analysis on the stored data which could be both structured and unstructured even semi-structured, however, the data that is in the warehouse cannot be modified. Data warehousing basically helps companies gain insight regarding factors influencing business, and they could use the data insight to formulate new strategies, developing products and so on. This highly skilled task demands professionals who have a background in Data science using python training.

What are the different steps in data warehousing?

Data warehousing involves the following steps

Transactional data extraction: In this step, the data is extracted from multiple sources available and loaded into the system.

Data transformation: The transactional data extracted from different sources need to be transformed and it would need relating as well.

Building a dimensional model: A dimensional model comprising fact and dimension tables are built and the data gets loaded.

Getting a front-end reporting tool: The tool could be built or, purchased, a crucial decision that needs much deliberation.

Benefits of data warehousing

An edge over the competition

This is undeniably one benefit every business would be eager to reap from data warehousing.  The data that is untapped could be the source of valuable information regarding risk factors, trends, customers and so many other factors that could impact the business. Data warehousing collates the data and arranges them in a contextual manner that is easy for a company to access and utilize to make informed decisions.

Enhanced data quality

Since data pooled from different sources could be structured or, unstructured and in different formats, working with such data inconsistency could be problematic and data warehousing takes care of the issue by transforming the data into a consistent format. The standardized data that easily conforms to the analytics platform can be of immense value.

Historical data analysis

A data warehouse basically stores a big amount of data and that includes historical data as well. Such data are basically old records of the company regarding sales, employee data, or, product-related information. Now the historical data belonging to different time periods need to be analyzed to predict upcoming trends.

Smarter business intelligence

Since businesses now rely on data-driven insight to devise strategies, they need access to data that is consistent, error-free, and high quality. However, data coming from numerous sources could be erroneous and irrelevant. But, data warehousing takes care of this issue by formatting the data to make it consistent and free from any error and could be analyzed to offer valuable insight that could help the management take decisions regarding sales, marketing, finance.

High ROI

Building a data warehouse requires significant investment but in the long term, the revenue that it generates can be significant. In fact, keen business intelligence now plays a crucial role in determining the success of an organization and with data warehousing the organizations can have access to data that is consistent and high quality thus enabling the company to derive actionable intel.  When a company implements such insight in making smarter strategies, they do gain in the long run.

Data Science Machine Learning Certification

Data warehousing plays a significant role in collating and storing valuable data that fuels a company’s business decisions. However,  given the specialized nature of the task, one must undergo Data Science training, to learn the nuances. The field of big data has plenty of opportunities for the right candidates.


.

How Computer Vision Technology Is Empowering Different Industries?

How Computer Vision Technology Is Empowering Different Industries?

Computer vision is an advanced branch of AI that revolves around the concept of object recognition and smart classification of objects in images or, videos. This is indeed a revolutionary innovation that aims to simulate the way human vision is trained to identify and classify objects. Studying deep learning for computer vision course can help gain specialized knowledge in this field. The growing application of computer vision across industries is now opening up multiple career avenues.

The application of computer vision is changing different industries:

Healthcare

In healthcare computer vision technology is adding efficiency to medical imaging procedures such as MRI. Detecting even the smallest of oddity is now possible which ensures accurate diagnosis. In departments like radiology, cardiology,  computer vision techniques are gradually being adopted. Not just that, during surgical procedures too computer vision can offer cutting edge solutions. A case in point here would be Gauss Surgical’s blood monitoring system that analyzes the amount of blood loss during surgery.

Automotive

The self-driving cars are no longer a sci-fi theme, but, a hardcore reality, computer vision technology analyzes the road conditions, detects humans crossing the road, objects as well as road signs and lane changes. There are advanced systems that aim to prevent accidents that run on the same technology and could also signal if the driver behind the wheel is not awake, thus saving lives in real-time.

Manufacturing

The manufacturing industry is reaping benefits of computer vision technology in so many ways. Using computer vision the equipment condition can be monitored and measures could be taken accordingly to prevent untimely breakdown. Maintaining production quality also gets easier with computer vision application as even the smallest defect in a product or, on the packaging could be detected which might get missed by human eyes. Not just that but, even the labels could be efficiently screened to detect printing errors.

Agriculture

In the field of agriculture, computer vision technology is helping maintain quality and adding efficiency. Using drones to monitor the crops is getting easier, not just that but computer vision technology is helping farmers separate crops as per quality and decide which crop could be stored for a long time. Livestock monitoring is another job that could be efficiently handled using computer vision technology.  However, one significant application is perhaps using computer vision to detect crops that are infected and need pesticide.

Military applications

Computer vision can add an edge to modern warfare, its adoption in the military surely indicate that. Autonomous vehicles powered with computer vision techniques can save so many lives, especially when deployed during battles. Not just that, but detecting landmines, or, enemy, both high-risk yet extremely important operations can be handled successfully by adopting computer vision techniques. Image sensors could deliver the intelligence the military think-tank needs to take timely decisions.

Surveillance

Surveillance is a highly crucial area that could immensely benefit from computer vision applications. In shops preventing crimes like shoplifting could become easier, as the cameras could easily detect any kind of suspicious behavior and activity going on in the shop premises. Another factor to consider here would be the application of facial recognition to identify miscreants from videos.

Data Science Machine Learning Certification

Computer vision technology is changing the way we look at our world, and with further research, there would be smarter products on the market that can truly transform our lives by allowing us to be more efficient. For someone aspiring to make a career in this promising domain should undergo computer vision course python training.


.

Advertising Gets Smarter With Machine Learning

Advertising Gets Smarter With Machine Learning

Every single day we get deluged by advertising messages in many formats. From your morning newspaper to Youtube to Facebook, there is hardly a platform left that is not getting utilized by smart marketers. After all, advertising is a powerful marketing tool with the power to sway opinions in favor or, against, and careful planning and placement play a crucial role in making an ad click with the target audience. The digital era has opened up multiple avenues for the advertisers but, it has also posed new challenges for them.

To stay ahead in the game advertisers have been quicker to recognize the potential of integrating advanced technology such as Machine Learning to optimize their ad campaigns. ML algorithms can process data and analyze patterns to offer predictions that in turn helps marketers fine-tune their marketing strategies.

Google AdWords is a case in point that has incorporated machine learning to leverage their ad game. Marketing professionals now should upskill themselves with Machine Learning course in Delhi, to ensure seamless integration of this technology into advertising.

How ML is benefiting the advertising industry?

ML can boost ad performance

Incorporating machine learning techniques can reduce the time, labor, and amount of error that go into processing data to identify factors that when tweaked could positively influence your ad performance.  Machine learning not only automates the task but, also comes up with several solutions keeping your goal and budget in mind as well as other significant criteria. With time the more data get fed into the system the more accurate results could be expected. 

 Ad Creatives get better

 Creative ads draw more attention, a catchy headline, slogan or, visual or, the combo of all these elements coupled with others contribute to making an ad a roaring success and in turn, boosting a product or brand image. Now, one might wonder what algorithms have to do with creative thinking which is completely a spontaneous affair, but, ML might be of help in here. Before investing money in designing creatives, use ML to assess past campaigns to measure all the elements and offer insight regarding imagery, color, font style, size, messages, and other factors. Furthermore, different personality types react differently to a given message, so gaining an insight into that behavior pattern is vital before delving into designing.

Be more relevant and relatable

Advertising is all about delivering the message to the targeted audience, but, instead of just sorting through random survey data to identify groups, using ML to go deeper into the process can create a big impact on the results. Using ML techniques social media interactions of people could be parsed to identify areas that interest them, people that influence them, and so on. Another factor that matters here is to identifying the right combination of time and platform to reach your target audience to make the maximum impact, ML algorithms enable you to do all of that.

Better segmentation

While designing any ad campaign, the marketer needs to identify the segment they are targeting. Instead of applying age-old methods that only scratch the surface, smart algorithms can dive in to help you be more specific about your segments and not just that but it could also identify that layer of audience hidden in the data who normally do not come under your segmentation, but has the potential to convert into paying customers if approached.

Data Science Machine Learning Certification

Predict campaign results

Implementation of ML can ensure that you get to test the success or, failure of your campaign even before it hits the viewers. Assessment of previous campaigns coupled with customer data using ML techniques can give you an idea regarding the performance of your campaign. It allows you to rectify or, revise any strategy that might sound or, look iffy. It can also help you make smart media buying decisions and point you towards platforms that you didn’t consider in the first place.

The field of advertising is deriving huge benefits from incorporating ML technology. However, choosing the right tool that works best for the specific needs of a campaign is essential. Another factor is having trained employees with a background in Machine Learning Using Python, is essential as they would be in charge of implementing and monitoring the technology.


.

Call us to know more