This is the 3rd part of the ongoing Regex or, regular expression in Python series where we are discussing how to handle textual data. In the second part we introduced you to the re library and in this third segment, we are going to be discussing how to substitute characters or, words with re library.
Re library has a wide range of methods to deal with textual data, one such method is .sub() which helps us substitute alphabets or words based on the patterns we build. This method can be used with .match() method and .search() method, both having differences in the way they extract a pattern.
Difference between .match() & .search()
.match() :- This method extracts the required text only at the begging.
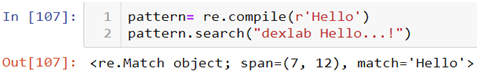
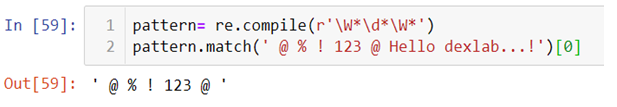
.search() :-This can extract the required string from the entire text but only at the first occurrence
In the above code you can see that even though the word “Hello” is in the middle of the text we are able to fetch it because of the special attribute of the .search() method. Here we are again using “Hello dexlab…!” as an example and .compile() is being used to create and apply our pattern.
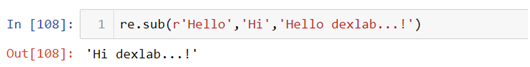
Now suppose if we want to substitute the word “Hello” with another string “Hi” we will have to use .sub() method from the re library. But there are ways to use this method directly or indirectly.
First let’s see the direct method.
In the above line of code we first mention what we want to substitute and with what and then we add the text.
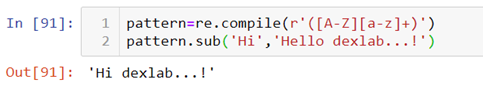
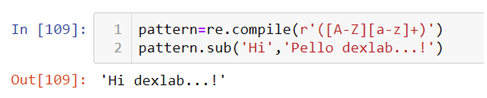
Second way to do this is by first using .compile() method to build the pattern and then use that pattern to substitute the alphabet or word.
The above pattern in the .complie() method states that there is a word with the first alphabet in uppercase combined with lowercase alphabets to be substituted with the word “Hi”. This pattern can match any string with the same characteristics, for example:-
Look at the text used in the .sub() method, now instead of “Hello” we have “Pello” with the same characteristics substituted with the word “Hi”. But one must not forget this pattern can also be used in the .sub() method directly and the use of .compile() method is optional. .compile() method is used only to create an object based code.
So, this wraps up the discussion on how to substitute characters or, words with re library. Hopefully, you found this blog informative, if you wish to find more Python Certification course topics, keep following the Dexlab Analytics blog.
This is the second part of the Regex series, where we will be continuing on by introducing you to another library in python, the re library. The previous blog introduced you to the Regex library in Python, and you learned about meta-characters and literals which could be used for creating patterns. This particular segment is about introducing the re library to help you with textual data analysis.
Re library in python holds the key to deal with all the problems relating to textual data analysis. This library provides a range of methods that can help you build patterns and extract or substitute the desired string. For example, suppose you want to change all the negative words to positive in a novel, for that all you need to have is a soft copy of the same and then you can import the re library and use its predefined methods first to make a pattern to extract the words and then substitute it to make the required changes.
Here one such method which we are going to use today from the re library is .compile() combined with .match() method to build and extract the pattern with the help of literals and meta-characters explained in the previous blog.
.compile() and .match() Methods
.complie() is used to build the pattern. You can use the meta-characters and literals within the parenthesis to build the pattern of the word which you want to extract or change. This is practically the first step without which not much can be done in re library. But why do we need a pattern and what is it that makes it necessary? To answer this question I am going to use few steps:-
First thing to do is to observe the word or the string and see what is it that makes that specific word or words which you want to extract different from the rest of the text i.e. is the word a combination of digit or alphabet or special character, is there a special character before and after the word etc.
Now recall all the meta-characters we have studied so far.
Combine them with the .complie() method which basically helps us bring the meta-characters together.
Now all there is left for us to do is apply the pattern on the text.
Therefore knowledge of meta-characters is necessary to form patterns to manipulate your textual data.
Now let’s see how to import re library and practically solve few of the Regex questions.
Use the above code to import the Regex library.
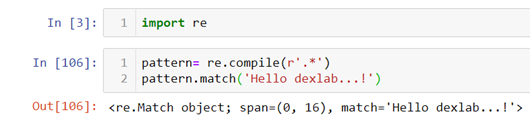
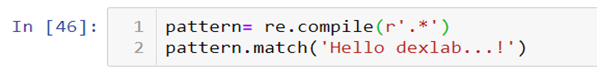
Question 1: How to make a pattern to extract the entire string “Hello dexlab…!!”?
In the above code we are using a combination of. (period)and * where
. (period) means match alpha-numeric or special character
* means match anything zero or more times
When combined together this means that you can match alpha-numeric or special characters zero or more times. Therefore the end result is:-
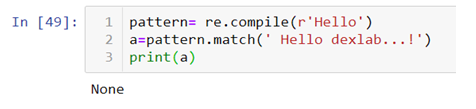
.match()method has a special property that it can match anything only at the beginning of the line. Suppose I want to extract “Hello” from a string, .match()method will only work when word is at the 0 index.
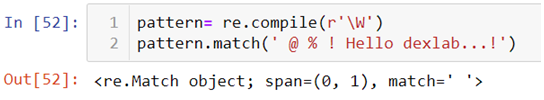
Question: How to extract and match only special characters?
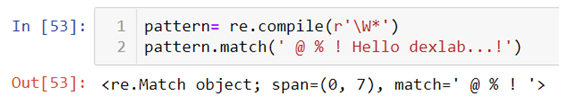
The above code is matching only the space which is at the 0th index but not all the simultaneous special characters. To make a pattern that can match all the special characters we can use *
You can try ? and + to check the difference it makes on the output.
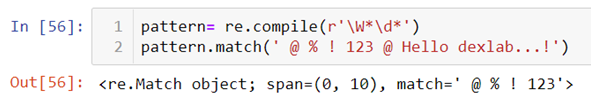
Question: How to extract numbers and special characters?
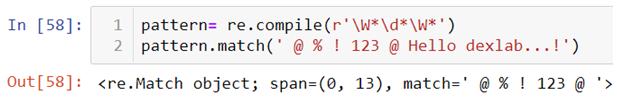
Now you must be wondering why the above code did not recognize the special characters after the numbers like @ and space. Here you must remember that the output you get is based on the pattern you make. In the above code we mentioned nothing that matches anything after the numbers. So we further need to expand our line of codes.
Question: How to extract only the output?
You can use the slice operator [] to extract only the text by using 0 index.
You must have picked up the fundamentals of the re library from the blog, watch the video attached below to follow the tutorial step by step. Follow the Regex series to gain expertise in textual data handling. Dexlab Analytics blog has more interesting and informative posts on Python Programming training.
Python is a versatile programming language and it has a rich library. In the visualization series we introduced you to different libraries used for data visualization purposes. Now, we introduce you to the Regex library in Python for handling textual data.
In Python to perform pattern recognition on textual data Regex is a library that provides a range of methods which when used with right pattern gives us the desired results. For example, if you want to change the spelling of colour to color in your text you can easily do so with the help of a given method provided that you form the pattern correctly.
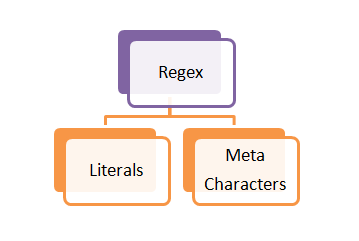
Type of textual data in Regex
Literals:- In Python literals are the characters or words with their original meaning intact like the word dog means a literal dog and there is no hidden meaning behind that word.
Meta-characters:- These are the words or characters which hold special meaning for example \n means a new line or \t means tab separated values.
Given below are few of the meta-characters used in python with their meanings:-
\w – Matches alpha-numeric characters i.e. \w= 1, \w= a, \w\w= a1
\W– Matches special characters i.e. \W= %
Dog[ogn]– Matches a single character within the square bracketsi.e. Dogo, Dogg, Dogn
Dog(ogn) – Matches the entire string within the parenthesisi.e. Dogogn
Dog(ogn|aaa)– Matches either ogn or aaa i.e. Dogogn or Dogaaa
*– Matches 0 or more characters i.e. tre* = tree, tre*= tr, tre*= treeeeee
?– Matches 0 or 1 character i.e. colou?r= color, colou?r= colour
+ – Matches 1 or more character i.e. tre+= tree, tre+= treee, tre+≠tre
. – Matches alpha-numeric or special characters but only one time i.e. tre.= tree, tre.= tre#, tre.=tre1, tre.≠tre#1
The above meta-characters alone or in combination are used to form a pattern which then are used for text mining for example tre.* means match anything 0 or more times that means now we can match tre#1 or tre.
Watch the video tutorial attached below to learn more about the fundamentals of this library.
Hopefully you found the discussion on Regex library helpful and at the end of it you must have become familiar with the way this particular library works. To learn more about python for data analysis, keep on exploring Dexlab Analytics blog, where you will always find informative posts.
In our fifth installment of the visualization series using Python programming language, we introduce you to another powerful library in Python that is the Pandas_bokeh library. So, let’s find out what you can achieve with Pandas_bokeh library.
Pandas_bokeh is a library which can help you create interactive graphs in python. One can zoom in, zoom out, select a certain portion of the graph to see, move the plot left, right and center, create tabs in case they want to see a single plot at a time, create multiple plots at a time, create widgets like dropdown list, check boxes, radio buttons, slider etc. It is similar to the shiny app which is used in the r programming language but simpler and faster.
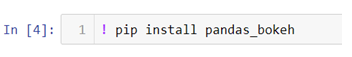
How to install pandas_bokeh?
In the above code we are changing our jupyter notebook code cell into a command line by using ! and then we can use pip (python installation package) to install the library.
How to create a simple line plot using pandas_bokeh ?
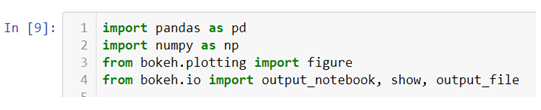
The first thing to do is import the libraries which we will be using to create a line plot.
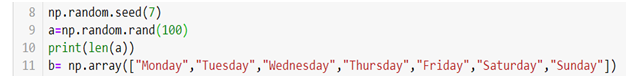
We will be creating our own dataset here and for that we need to import Numpy and Pandas libraries. Also we will be importing .figure() method from plotting module to create our canvas on which we will be building our graph from the scratch and we will also be importing .output_notebook() method to visualize our graph on jupyter notebook and to visualize our graph on a new tab and save at the same time we can use .output_file() method.
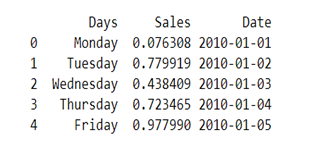
The Dataset we are creating here will have three columns ‘Days’, ‘Sales’ and ‘Date’.
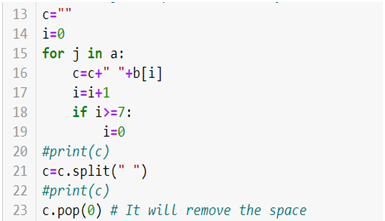
We will be creating a dataset with hundred observations in each column so for that we are using .rand() method to generate hundred random numbers and that will be our ‘Sales’ column data. Now for our ‘Days’ column we will be creating a loop which will run hundred times and each time an array index value will be saved in a variable c which has an empty string and .split() method is then used to create a list of that string.
For creating a ‘Date’ column we will be using the following code
At last create a data frame we will be using .DataFrame() method.
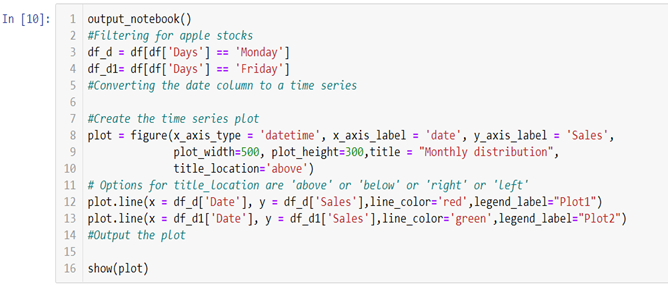
Now to create two line graphs on a single canvas we will be using object-oriented programming.
To build the graph on the jupyter notebook we are using .output_notebook() method and in case you want to plot the graph on a new tab you can use .output_file(“filename.html”) method.
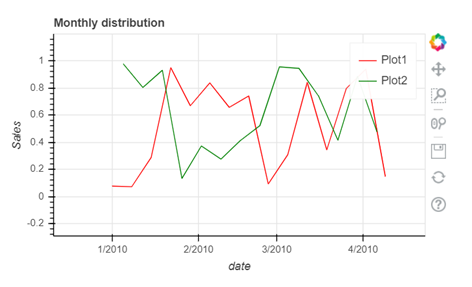
In the above line of codes we are creating two separate data frames df_d and df_d1 each containing Monday and Friday’s sales and dates separately now all we need to do is build a canvas using .figure() method and use few other arguments like x_axis_type to define the data type of the x axis and x_axis_label and y_axis_label to set graph labels, to adjust width and height of the canvas we have used plot_width and plot_height argument and to set title and title location we have used title and title_location. Once we have our canvas ready we can use .line() method and add x axis and y axis data to plot our graphs.
To interact with your graph you can use the icons on the right hand side corner which will help you zoom in and out, look at a certain part of the graph, scroll to zoom in and out, save your plot and reset the changes made by you using the side icons.
The video tutorial attached below will help you gain better understanding.
At the end of this segment you must have become familiar with the nuances of the Pandas_bokeh library. As you continue on with the series, you will realize that you are becoming an expert in visualization. On Dexlab Analytics blog, you will find interesting blogs on various topics related to Python certification training.
This is the 4th part of the series on visualization using Python programming language, where we will continue our discussion on the Seaborn library. Now that you have become familiar with the basics of the Seaborn library, you will be learning specific skills such as learning to create a box plot using Seaborn. So, let’s begin.
Seaborn library offers a list of pre-defined methods to create semi-flexible plots in Python and one of them is. boxplot() method. But what is a box plot?
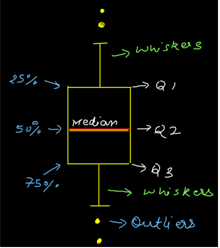
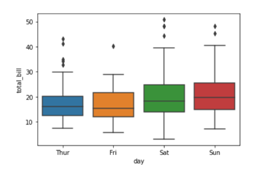
Answer:- A box plot often known as box and whisker plot is a graph created to visualize the distribution of numerical data and skewness through displaying the data quartiles (or percentiles) and median.
Creating a box plot
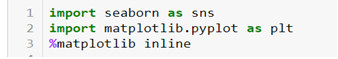
Let’s begin by importing the Seaborn and Matplotlib library.
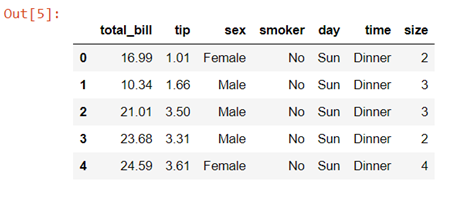
We will again be using the tips dataset which is a pre-defined dataset in Seaborn
Data description:- This is a dataset of a restaurant which keeps a record of the amount of bill paid by a customer, tip amount over the total bill paid, gender of the customer, whether he or she was a smoker or not, the day on which they ate at the restaurant, what was the time when they ate at the restaurant and the size of the table they booked.
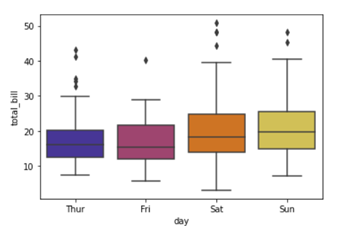
To create a box plot we will be using .boxplot() method.
On the x axis we have day column having categorical data type and on the y axis we have total_bill column having numerical data type. Thus for each day with the help of a box plot we will be able to visualize how the total_bill changes around its median value.
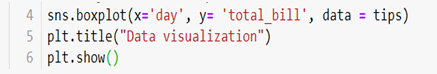
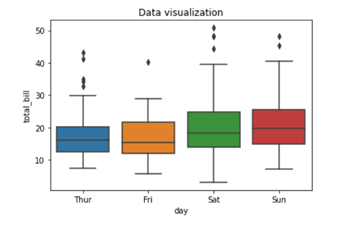
To add title to the graph we can use. title() method from the Matplotlib library
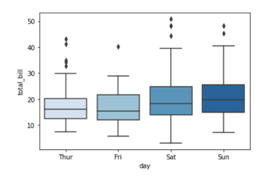
To add color to your graph you can use palette argument
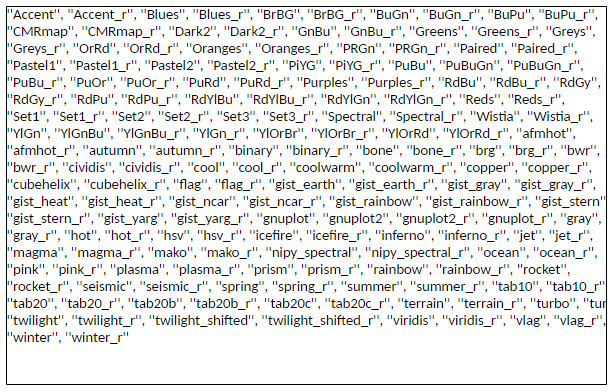
We are adding a list of palette colors in this blog down below:-
You can replace the color mentioned in the above code to see which color variations you would prefer in your graph. For example
Here we are using color palette ‘CMRmap’ to change my graph color from different shades of blues to a completely different color range i.e. from blues to orange, violet, pale yellow etc.
This tutorial hopefully, has clarified the concept and you can now create boxplots with Seaborn. Since this is a series you need to keep track of all the parts to be a visualization expert as we take you through the process step by step. Follow the Dexlab Analytics blog to access more informative posts on different topics including python for data analysis.
Go through the video tutorial attached below to get more in-depth knowledge.
In an era that is being significantly impacted by AI, it is but obvious that many AI-powered innovations would gradually seep through and influence the traditional work settings. RPA or, Robotic Process Automation is a key AI solution that is changing the way businesses function by automating the tasks performed by humans and increasing productivity along the way.
RPA is all about automating tasks that are mundane and repetitive, it is business process automation that automates the time consuming repetitive tasks to increase productivity and efficiency while speeding up the process and minimizing errors. Having artificial intelligence certification in delhi ncr, is vital for professionals aspiring to work in such cutting edge technology driven environment.
The benefits of RPA:
RPA, is no doubt a technology that has the power to revolutionize the way humans traditionally work. The process has certain benefits to offer, let’s find out what those are.
Cost-effective and efficient: When an organization employs bots, it can expect to cut down the cost significantly. Not just that but, the maintenance of human workers can be challenging, humans are not physically able to work beyond a set time limit. The robots can easily work long hours, they do not need breaks and are less expensive than human counterparts.
Increases productivity: When human employees are freed from their mundane activities they can put their skills to better use. They can work on clients, or, handle some other areas that require specific human skills. When the workers are entrusted with productive work they derive job satisfaction and feel motivated to focus on tasks that generate higher revenue.
Better for the environment: RPA ensures the organization follows the path of digitization which results in a reduction in the usage of papers. All the files that are to be handled are in the digital format eliminating the need to use papers.
Fewer chances of error: When humans are involved in carrying out mundane tasks, the room for error would be there too. However, once the process gets automated and handled by bots the chance of error gets eliminated and the tasks get performed more accurately and efficiently.
Improved IT: When RPA capabilities make their way into the organization one can expect a higher level of efficiency, but, the best part of RPA is that, unlike other technologies no new IT system needs to be devised, the existing system can be used by the RPA system, which saves the organization the pain of bearing the cost of substituting the existing system.
Smarter analytics: When RPA is employed there can be no more errors in the analytics. The system collects every microdata possible regarding the organization and helps the management get actionable insight. The RPA system also works great for monitoring purposes.
Seamless communication and security: RPA can ensure that all the information is updated and reaches every segment seamlessly. Earlier any change would need to be communicated by manually updating and it was less efficient, time-consuming and tiring. However, with RPA in place every tiny change made gets automatically updated and the system also keeps the data secure.
Given the benefits offered by RPA, it is no doubt that most organizations would be eager to adopt the technology. However, the demand for professionals who are well proficient in handling AI, Big Data is also on the rise. Getting a degree from a reputed artificial intelligence training institute in Gurgaon, might help one gab the dream job in this sector.
As we continue our discussion on statistical inference, we move on to the estimation theory. Here you will learn about the concept of estimation, along with different elements and methods of estimation. You can check part-II here.
The estimation is the process of providing numerical values of the unknown parameter to the population. There are mainly two types of estimation process Point estimation and Interval estimation and confidence interval is the part of the interval estimation. We will also discuss about the elements of the estimation like parameter, statistic and estimator.
The characteristics of estimators are – (i) Unbiasedness – This is desirable property of a good estimator. (ii) Consistency – An estimator is said to be consistent if increasing the sample size produces an estimate with smaller standard error. (iii) Efficiency – An estimator should be an efficient estimator. (iv) Sufficiency – An estimator is said to be sufficient for a parameter, if it contains all the information in the sample regarding the parameter.
The methods of estimation are– (i) Method of maximum likelihood, (ii) Method of least square, (iii) Method of minimum variance, (iv) Method of moments.
Element For Estimation
Parameter
Parameter is an unknown numerical factor of the population. The primary interest of any survey lies in knowing the values of different measures of the population distribution of a variable of interest. The measures of population distribution involves its mean, standard deviation etc. which is calculated on the basis of the population values of the variable. In other words, the parameter is a functional form of all the population unit.
Statistic
Any statistical measure calculated on the basis of sample observations is called Statistic. Like sample mean, sample standard deviation, etc. Sample statistic are always known to us.
EstimatorAn estimator is a measure computed on the basis of sample values. It is a functional from of all sample observe prorating a representative value of the collected sample.Relation Between Parameter And Statistic
Parameter is a fixed measure describing the whole population (population being a group of people, things, animals, phenomena that share common characteristics.) A statistic is a characteristic of a sample, a portion of the target population. A parameter is fixed, unknown numerical value, while the statistic is a known number and a variable which depends on the portion of the population. Sample statistic and population parameters have different statistical notations: In population parameter, population proportion is represented by P, mean is represented by µ (Greek letter mu), σ2 represents variance, N represents population size, σ (Greek letter sigma) represents standard deviation, σx̄ represents Standard error of mean, σ/µ represents Coefficient of variation, (X-µ)/σ represents standardized variate (z), and σp represents standard error of proportion.
In sample statistics, mean is represented by x̄(x-bar), sample proportion is represented by p̂(p-hat), s represents standard deviation, s2 represents variance, sample size is represented by n, sx̄ represents Standard error of mean, sp represents standard error of proportion, s/(x̄) represents Coefficient of variation, and (x-x)/s ̄ represents standardized variate (z).
What Is Estimation?
Estimation refers to the process by which one makes an idea about a population, based on information obtained from a sample.
Suppose we have a random sample 𝑥1, 𝑥2, … , 𝑥𝑛 on a variable x, whose distribution in the population involves an unknown parameter 𝜃. It is required to find an estimate of 𝜃 on the basis of sample values. The estimation is done in two different ways: (i) Point Estimation, and (ii) Interval Estimation.
In point estimation, the estimated value is given by a single quantity, which is a function of sample observations. This function is called the ‘estimator’ of the parameter, and the value of the estimator in a particular sample is called an ‘estimate’.
Interval estimation, an interval within which the parameter is expected to lie in given by using two quantities based on sample values. This is known as Confidence interval, and the two quantities which are used to specify the interval, are known as Confidence Limits.
Point Estimation
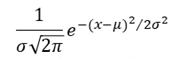
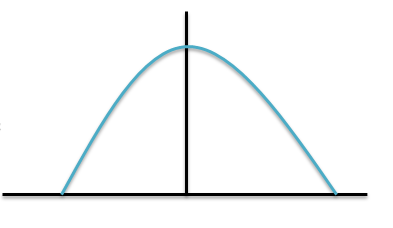
Many functions of sample observations may be proposed as estimators of the same parameter. For example, either the mean or median or mode of the sample values may be used to estimate the parameter 𝜇 of the normal distribution with probability density function
Which we shall in future refer to as 𝑁(𝜇, 𝜎 2 ).
Interval Estimation
In statistical analysis it is not always possible to find out an exact point estimate to form an idea about the population parameters. An approximately true picture can be formed if the sample estimations satisfy some important property such as unbiasedness consistency, sufficiency, efficiency & so on. So, a more general concept of estimation would be to find out an interval based on sample values which is expected to include the unknown parameter with a specified probability. This is known as the theory of interval estimator.
Confidence Interval
Let 𝑥1, 𝑥2,… , 𝑥𝑛 be a random sample from a population involve an unknown parameter 𝜃. Our job is to find out two functions 𝑡1 & 𝑡2 of the sample values. Such that the probability of 𝜃 being included in the random interval 𝑡1,𝑡2 has a given value say 1 − 𝛼 . So,
Here the interval [𝑡1,𝑡2] is called a 100 × ( ) 1 − 𝛼 % confidence interval for the parameter 𝜃. The quantities 𝑡1 & 𝑡2 which serve as the lower & upper limits of the interval are known as confidence limits. 1 − 𝛼 is called the confidence coefficient. The is a sort of measures of the trust or confidence that one may place in the interval for actually including 𝜃.
Characteristics of Estimation
Unbiasedness
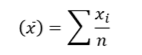
A statistic t is said to be an Unbiased Estimator of parameter 𝜃, if the expected value of t is 𝜃. 𝐸 𝑡 = 𝜃 Otherwise, the estimator is said to be ‘biased’. The bias of a statistic in estimating 𝜃 is given as 𝐵𝑖𝑎𝑠 = 𝐸 𝑡 − 𝜃 Let 𝑥1, 𝑥2,… , 𝑥𝑛 be a random sample drawn from a population with mean 𝜇 and variance 𝜎 2 . Then Sample mean
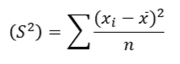
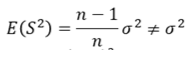
Sample varianceThe sample mean 𝑥ҧis an unbiased estimator of the population mean 𝜇; because 𝐸 𝑥ҧ = 𝜇 The sample variance 𝑆 2 is a biased estimator of the population variance 𝜎 2 ; because
An unbiased estimator of the population variance 𝜎 2 is given by
Because
The distinction between 𝑆 2 and 𝑠 2 in which only he denominators are different. 𝑆 2 is the variance of the sample observations, but 𝑠 2 is the ‘unbiased estimator’ of the variance (𝜎 2 ) in the population.
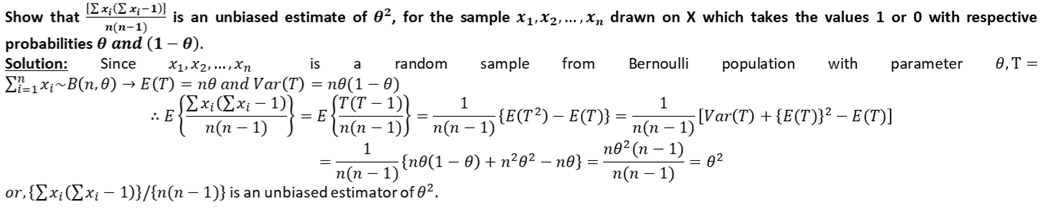
Example:
Characteristics of Estimation (Sufficiency, Efficiency, Consistency)
Consistency
A desirable property of good estimator is that its accuracy should increase when the sample becomes larger. That is, the estimator is expected to come closer to the parameter as the size of the sample increases.
A statistic 𝑡𝑛 computed from a sample of n observations is said to be a Consistent Estimator of a parameter 𝜃, if it converges in probability to 𝜃 as n tends to infinity. This means that the larger the sample size (n), the less is the chance that the difference between 𝑡𝑛 and 𝜃 will exceed any fixed value. In symbols, given any arbitrary small positive quantity 𝜖, 𝜇 , then the statistic 𝑡𝑛 will be a ‘consistent estimator’ of 𝜃. Consistency is a limiting property. Moreover, several consistent estimators may exist for the same parameter. For example, in sampling from a normal population 𝑁 𝜇, 𝜎 2 , both the sample mean and sample median are consistent estimators of 𝜇.
Efficiency
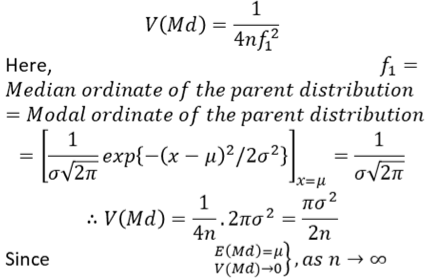
If we confine ourselves to unbiased estimates, there will, in general, exist more than one consistent estimator of a parameter. For example, in sampling from a normal population 𝑁 𝜇, 𝜎 2 , when 𝜎 2 is known, sample mean 𝑥ҧis an unbiased and consistent estimator of 𝜇. From symmetry it follows immediately the sample median (Md) is an unbiased estimate of 𝜇. Which is same as the population median. Also for large n,
Median is also an unbiased and consistent estimator of 𝜇.
Thus, there is necessity of some further criterion which will enable us to choose between the estimators with the common property of consistency.
Such a criterion which is based on the variance of the sampling distribution of estimators is usually known as Efficiency.
Sufficiency
A statistic is said to be a ‘sufficient estimator’ of a parameter 𝜃, if it contains all information in the sample about 𝜃. If a statistic t exists such that the joint distribution of the sample is expressible as the product of two factors, one of which is the sampling distribution of t and contains 𝜃, but the other factor is independent of 𝜃, then t will be a sufficient estimator of 𝜃.
Thus if 𝑥1, 𝑥2,… , 𝑥𝑛 is a random sample from a population whose probability mass function or probability density function is 𝑓 𝑥, 𝜃 , and t is a sufficient estimator of 𝜃 then we can write
Where g(t, 𝜃) is the sampling distribution of t and contains 𝜃, but ℎ (𝑥1, 𝑥2,… , 𝑥𝑛) is independent of 𝜃.
Since the parameter 𝜃 is occurring in the joint distribution of all the sample observations can be contained in the distribution of the statistic t, it is said that t alone can provide all ‘information’ about 𝜃 and is therefore “sufficient” for 𝜃.
Sufficient estimators are the most desirable kind of estimators, but unfortunately they exist in only relatively few cases. If a sufficient estimator exists, it can be found by the method of maximum likelihood.
In random sampling from a Normal population 𝑁 (𝜇, 𝜎 2) , the sample mean 𝑥ҧis a sufficient estimator of 𝜇.
Methods of Estimation (MLE, MLS)
Method of Maximum Likelihood
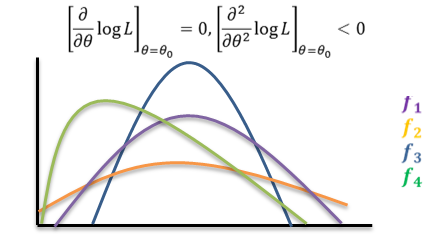
This is a convenient method for finding an estimator which satisfies most of the criteria discussed earlier. Let 𝑥1, 𝑥2,… , 𝑥𝑛 be a random sample from a population with p.m.f (for discrete case) or p.d.f. (for continuous case) 𝑓 𝑥, 𝜃 , where 𝜃 is the parameter. Then the joint distribution of the sample observations
is called the Likelihood Function of the sample. The Method of Maximum Likelihood consists in choosing as an estimator of 𝜃 that statistic, which when substituted for 𝜃, maximizes the likelihood function L. such a statistic is called a maximum likelihood estimator (m.l.e.). We shall denote the m.l.e. of 𝜃 by the symbol 𝜃0. Since log 𝐿 is maximum when L is maximum, in practice the m.l.e. of 𝜃 is obtained by maximizing log 𝐿 . This is achieved by differentiating log 𝐿 partially with respect to 𝜃, and using the two relations
The m.l.e. is not necessarily unbiased. But when the m.l.e. is biased, by a slight modification, it can be converted into an unbiased estimator. The m.l.e. tends to be distributed normally for large samples. The m.l.e. is invariant under functional transformations. If T is an m.l.e. of 𝜃, and 𝑔(𝜃) is a function of 𝜃, then g(T) is the m.l.e. of 𝑔(𝜃) .
Method Of Least Square
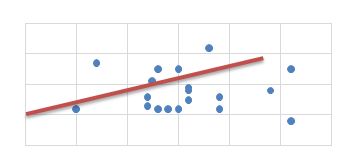
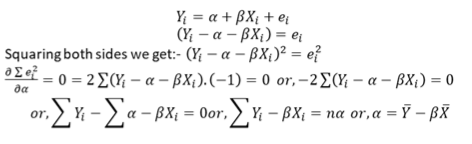
Method of Least Squares is a device for finding the equation of a specified type of curve, which best fits a given set of observations. The principal of least squares is used to fit a curve of the form:
𝑦𝑖 = 𝑓 𝑥𝑖 be a function where 𝑥𝑖 is an explanatory variable. & 𝑦𝑖 is the dependent variable. Let us assume a linear relationship between the dependent & independent variable. So,
The objective of the researcher is to minimize σ𝑙𝑖 2, σ 𝑒𝑖 is not minimized because σ 𝑒𝑖 = 0 but actual error of individual observation can remain
The method of least squares can be used to fit other types of curves, e.g. parabola, exponential curve, etc. method of least squares is applied to find regression lines and also in the determination of trend in time series.
Methods of Estimation (MMV, MM)
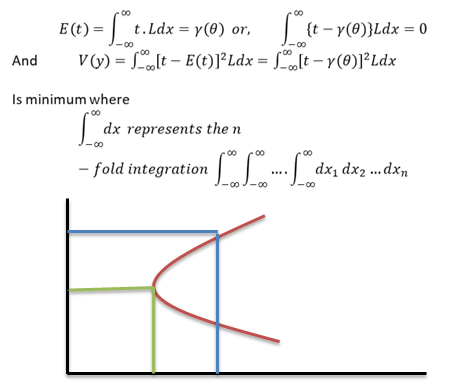
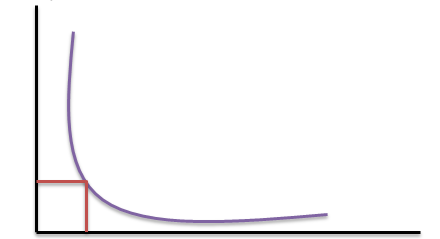
Method of Minimum Variance
Minimum Variance Unbiased Estimates, the estimates 𝑖 𝑇 𝑖𝑠 𝑢𝑛𝑏𝑖𝑎𝑠𝑒𝑑 𝑓𝑜𝑟 𝛾 𝜃 , 𝑓𝑜𝑟 𝑎𝑙𝑙 𝜃𝜖𝜗 are unbiased and [(ii) It has smallest variance among the class of all unbiased estimators of 𝛾(𝜃), then T is called the minimum variance unbiased estimator (MVUE) of 𝛾(𝜃)] have minimum variance.
If 𝐿 = ς𝑖=1 𝑛 𝑓 𝑥𝑖 , 𝜃 , is the likelihood function of a random sample of n observations 𝑥1, 𝑥2, … , 𝑥𝑛 from a population with probability function 𝑓(𝑥, 𝜃), then the problem is to find a statistics 𝑡 = 𝑡(𝑥1, 𝑥2,… , 𝑥𝑛), such that
Method of Moments
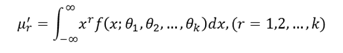
This method was discovered and studied in detail by Karl Pearson. Let 𝑓 𝑥; 𝜃1, 𝜃2, … , 𝜃𝑘 be the density function of the parent population with k parameters 𝜃1, 𝜃2,… , 𝜃𝑘. If 𝜇𝑟 ′ denoted the rth moment about origin, then
Let 𝑥𝑖 , 𝑖 = 1,2, … , 𝑛 be a random sample of size n from the given population. The method of moments consists in solving the k-equations for 𝜃1, 𝜃2,… , 𝜃𝑘 in terms of 𝜇1 ′ , 𝜇2 ′ ,… , 𝜇𝑘 ′ and then replacing these moments 𝜇𝑟 ′ ; 𝑟 = 1,2,… , 𝑘 by the sample moments,
Where 𝑚𝑖 ′ is the ith moment about origin in the sample.
Then by the method of moments 𝜃1, 𝜃2,… , 𝜃𝑘 are the required estimator of 𝜃1, 𝜃2,… . , 𝜃𝑘 respectively.
Conclusion
Estimation theory is a branch of statistics and signal processing that deals with estimating the values of parameters based on measured/empirical data that has a random component. The parameters describe an unknown numerical factor of the population. The primary interest of any survey lies in knowing the values of different measures of the population distribution of a variable of interest. The measures of population distribution involves its mean, standard deviation etc. which is calculated on the basis of the population values of the variable. The estimation theory has its own characteristics like the data should be unbiased, a good estimator is that its accuracy should increase when the sample size becomes larger, The sample mean and sample median should be consistent estimators of parameter mean, The estimator is expected to come closer to the parameter as the size of the sample increases. Two consistent estimators for the same parameter, the statistic with the smaller sampling variance is said to be more efficient, so, efficiency is another characteristic of the estimation. The estimator should be sufficient estimator of a parameter theta.
The estimation theory follows some methods by this method and with the characteristics we can properly estimate from the data. The methods we already discussed that maximum likelihood method, least square method, minimum variance method & method of moments.
In real life, estimation is part of our everyday experience. When you’re shopping in the grocery store and trying to stay within a budget, for example, you estimate the cost of the items you put in your cart to keep a running total in your head. When you’re purchasing tickets for a group of people or splitting the cost of dinner between 8 friends, we estimate for ease. In many other field we can use the estimation theory specially for statistical analysis.
If you found this blog helpful then, then keep on exploring DexLab Analytics blog to pursue more informative posts on diverse topics such as python for data analysis. Also, check out part-I AND part- II of the series to keep pace.
In the digital era we live in, nearly every transaction we do take place online and we leave a trail behind in the process which is easy to track for anyone with considerable skill in hacking. If you take a look at the state of cybercrime you are bound to feel worried because the hackers are also utilizing the latest technology and their recklessness is resulting in incidents like identity thefts.
Identity theft is increasingly becoming a threat for individuals and organizations, resulting in a huge amount of financial loss. Identity theft could occur in different ways, such as via sending fake mails which if you open can be used to grab sensitive information from the device you are using, or, via dumpster-diving methods. The problem with identity theft is that you get to learn about it much later and after losing a significant amount of money. Most of the time the amount lost cannot be recovered.
However, using machine learning techniques it is possible to overcome the shortcomings of traditional methods employed for ID theft detection and stay one step ahead to outwit the perpetrators. Machine learning has the potential to devise a smarter strategy, but, there must be professionals who have done Machine Learning training gurgaon to be able to monitor the whole process. So, let’s take a look at how machine learning can better identity theft detection process.
Authentication tests could be conducted
Machine learning could scan and cross-verify the IDs with unknown database in real-time. Using techniques like facial recognition, biometrics could actually help offer some extra support to make the process absolutely perfect. The best part of implementing machine learning technology is that there would be constant monitoring of the data. By doing so, the detection could be almost instantaneous and people could be alerted before it has a chance to snowball into something big.
Patterns get identified
Machine learning wades through tons of data to identify patterns, which could come in real handy during the process of identity theft detection. When you use your phone or laptop every day for different tasks, you do that in a set manner, but, when that device gets compromised that pattern would certainly change. While scanning data the machine learning algorithms can detect a threat by spotting an oddity and could help in taking preventive action.
Decisions could be made in real-time
Machine learning can automate the whole process of data analytics and remove the chance of human error. Machine learning also allows us to make decisions in real-time to prevent fraud or, could also send alerts, the implementation of ML can speed up the whole process thereby making it more efficient. The organizations instead of running after false alerts could actually use a solution to address a real threat without wasting a single valuable moment.
Handling big datasets
Handling a huge amount of data every single day could be an impossible task for a team comprising humans. But, the machine learning system can not only handle giant data sets, but it also thrives on data. The more datasets get fed into the system the more refined and accurate results could be expected of it. It needs data to identify the differences between genuine transactions and fraud cases.
Keeping the devices secure
Cases like identity theft could take place when devices get stolen. Now machine learning is being integrated with mobile devices to keep the devices protected from malware threats, features like biometric facial recognition are also there to ensure that the device cannot be compromised.
Application of machine learning can not only detect identity thefts but, can also prevent such attacks from happening. However, just implementation is not going to be enough, constant monitoring by a person having Machine Learning Using Python training is necessary. For some reason, if some threat goes undetected without raising any alarm the system might repeat that pattern, so monitoring is important.
The journey of AI and Data has been quite impressive and India is one of the smart countries that recognized the true potential both hold. Several industries are gearing up to adopt the AI technology to enhance their capabilities. The push for developing better models to utilize big data to derive smarter solutions is also there. The changing scenario is also gradually shaping up the future learning path of the current generation of Indians, as a significant chunk of them is steering their career towards the new pastures being created by AI. The demand for professionals trained in big data training in gurgaon, is on the rise and there is good news awaiting them.
India could envision a brighter future as a recent report from Nasscom predicts that by the year 2025, India’s GDP could expect leverage from Artificial Intelligence (AI) and data as, the combined contribution of both technologies could hover around $450-$500 billion. The report ‘Unlock Value from Data and AI: The Indian Opportunity’, is seeing this as a great opportunity that could give a boost to India’s economic growth and also aid in its recovery.
Nasscom has an action plan ready for India, it identified five key areas and it recommends that we need to put our focus on these core areas namely strategy, data, technology stack, talent, and execution. Nasscom’s report further elaborates that in the context of the current pandemic situation which is slowing down the global economy, India could assume a leadership position if it takes a holistic approach towards data utilization and AI effort.
The Nasscom report and the proposed action plan have been reviewed by the industry leaders and recommendations were sent to PM Narendra Modi. Ravi Shankar Prasad, the Minister of Law and Justice, Communications, Electronics and IT, sounded hopeful as he said that digital India helped reimagining the way the government stays connected to its citizens and AI and other technologies would push this objective further, he also said “.. In order to harness its full potential, India needs to embrace AI innovation and regulation with an open, inclusive…and a collaborative mindset,”.
There was a virtual launch of the report followed by a panel discussion where Wipro chairman Rishad Premji, opined “How do we ensure we move beyond from pilots to scalability. We do a great job in starting ideas off and getting them into pilot mode, but how do we get real scale where the magic lies and identify the challenges that lie in getting a pilot to scale,” Nasscom chairman UB Pravin Rao, seconded his view and insisted that the focus should be on execution.
The report suggested three interventions to create a ‘vibrant data economy in India’, and further recommended that high-quality data sets, data governance standards, and data marketplace need to be developed to realize the goal of creating a ‘vibrant data economy’. India needs to fortify its capabilities to position itself as a global hub and thereby open doors to investment, jobs and of course further innovation.
The report further stresses the need to build an AI innovation ecosystem and engage the private sector and entrepreneurs to realize the goals. Debjani Ghosh, President, Nasscom, pushed the discussion further by stressing “Data and AI’s true potential emerges from its ability to drive transformation across multiple sectors through a diverse range of applications. The report articulates the key structural steps that India needs to take to realise the value of this opportunity,”
Truly India needs to work on developmental policies as per the recommendations in the report and start putting brilliant minds together to realize a smarter future driven by the combined forces of AI and data, a future that certainly belongs to us.