In this blog, we are going to be discussing a statistical technique, ANOVA, which is used for comparison.
The basic principal of ANOVA is to test for differences among the mean of different samples. It examines the amount of variation within each of these samples and the amount of variation between the samples. ANOVA is important in the context of all those situations where we want to compare more than two samples as in comparing the yield of crop from several variety of seeds etc.
The essence of ANOVA is that the total amount of variation in a set of data is broken in two types:-
The amount that can be attributed to chance.
The amount which can be attributed to specified cause.
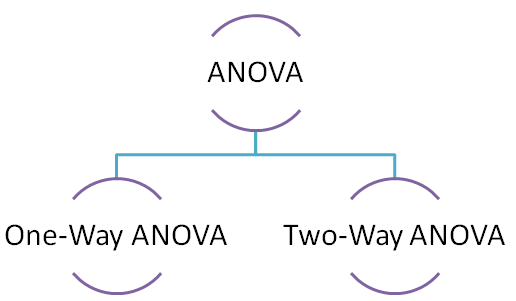
One-way ANOVA
Under the one-way ANOVA we compare the samples based on a single factor. For example productivity of different variety of seeds.
Stepwise process involved in calculation of one-way ANOVA is as follows:-
Calculate the mean of each sample X ̅
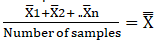
Calculate the super mean
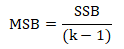
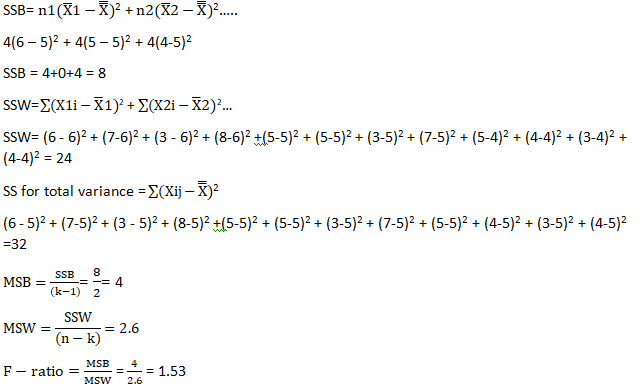
Calculate the sum of squares between (SSB) samples
Divide the result by the degree of freedom between the samples to obtain mean square between (MSW) samples.
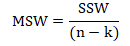
Now calculate variation within the samples i.e. sum of square within (SSW)
Calculate mean square within (MSW)
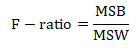
Calculate the F-ratio
Last but not the least calculate the total variation in the given samples i.e. sum of square for total variance.
Lets now solve a one-way ANOVA problem.
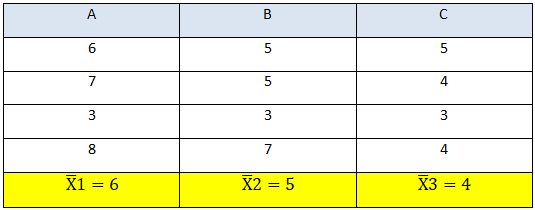
A,B and C are three different variety of seeds and now we need to check if there is any variation in their productivity or not. We will be using one-way ANOVA as there is a single factor comparison involved i.e. variety of seeds.
The f-ratio is 1.53 which lies within the critical value of 4.26 (calculated from the f-distribution table).
Conclusion:- Since the f-ratio lies within the acceptance region we can say that there is no difference in the productivity of the seeds and the little bit of variation that we see is caused by chance.
Two-way ANOVA will be discussed in my next blog so do comeback for the update.
Hopefully, you have found this blog informative, for more clarification watch the video attached down the blog. You can find more such posts on Data Science course topics, just keep on following the DexLab Analytics blog.
Artificial Intelligence or, AI is an advanced technology that is busy taking the world in its strides. With virtual assistants, face recognition, NLP, object detection, data crunching becoming familiar terms it is no wonder that this dynamic technology is being integrated into the very fabric of our society. Almost every sector is now adopting AI technology, be it running business operations or, ensuring error-free diagnosis in the healthcare domain, the exponential growth of this technology is pushing the demand for skilled AI professionals who can monitor and manage the AI operations of an organization.
Since AI is an expansive term and branches off in multiple directions, the job opportunities available in this field are also diverse. According to recent studies, AI jobs are going to be the most in-demand jobs in the near future. Multiple job roles are available that come with specific job responsibilities. So, let’s have a look at some of these.
Machine Learning Engineer
An machine learning engineer is supposed to be one of the most in-demand jobs available in this field, the basic job of an ML engineer center round working on self-running software, and they need to work with a huge pile of data. In an organization, the machine learning engineers need to collaborate with data scientists and ensure that real-time data is being put to use for churning out accurate results. They need to work with data science models and develop algorithms that can process the data and offer insight. Mostly their job responsibility revolves around working with current machine learning frameworks and working on it to make it better. Re-training machine learning models is another significant responsibility they need to shoulder.
If recent statistics are to be believed the salary of a machine learning hovers around ₹681,881 in India.
Artificial Intelligence Engineer
AI engineers are indeed a specialized breed of professionals who are in charge of AI infrastructure and work on AI models. They work on designing models and then test and finally, they need to deploy these models. Automating functionalities is also important and most importantly they must understand the key problems that need AI solutions. AI engineers need to write programs, so they need to be familiar with several programming languages, having a background in Machine Learning Using Python could be a big help. Another important responsibility is creating smart AI algorithms for developing an AI system, as per the specific requirement that needs to be solved using that system.
In India, an AI engineer could expect the salary to be around ₹7,86,105 per year, as per Glassdoor figures.
Data Scientist
A data scientist is going to be in charge of the data science team and need to work on the huge volumes of data to analyze and extract information, build and combine models and employ machine learning, data mining, techniques along with utilizing numerous tools including visualization tools to help an organization reach its business goals. The data scientists need to work with raw data and he needs to be in charge of automating the collection procedure and most importantly they need to process and prepare data for further analysis, and present the insight to the stakeholders.
A data scientist could earn around ₹ 7,41,962 per year in India as per the numbers found on Indeed.
AI Architect
An AI architect needs to work with the AI architecture and assess the current status in order to ensure that the solutions are fulfilling the current requirements and would be ready to scale up to adapt to the changing set of requirements that would arise in the future. They must be familiar with the current AI framework that they need to employ to develop an AI infrastructure that is sustainable. Along with working with a large amount of data, an AI architect must be employing machine learning algorithms and posses a thorough knowledge of the product development, and suggest suitable applications and solutions.
In India an AI architect could expect to make around ₹3,567K per year as per Glassdoor statistics is concerned.
There are so many job opportunities available in the AI domain, and here only a few job roles have been described. There are plenty more diverse job opportunities await you out there, grab those, just get artificial intelligence certification in delhi ncr and be future-ready.
In this blog we are discussing automation, a function for automating data preparation using a mix of Python libraries. So let’s start.
Problem statement
A data containing the following observation is given to you in which the first row contains column headers and all the other rows contains the data. Some of the rows are faulty, a row is faulty if it contains at least one cell with a NULL value. You are supposed to delete all the faulty rows containing NULL value written in it.
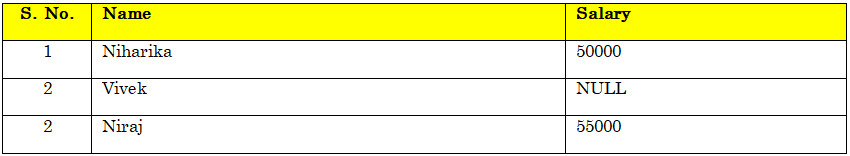
In the table given below, the second row is faulty, it contains a NULL value in salary column. The first row is never faulty as it contains the column headers. In the data provided to you every cell in a column may contain a single word and each word may contain digits between 0 & 9 or lowercase and upper case English letters. For example:
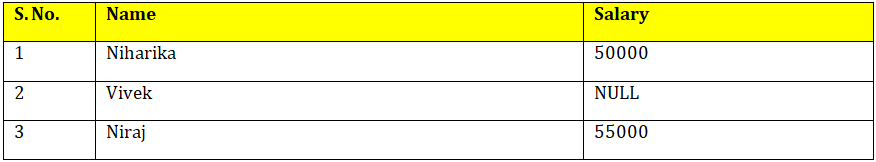
In the above example after removing the faulty row the table looks like this:
The order of rows cannot be changed but the number of rows and columns may differ in different test case.
The data after preparation must be saved in a CSV format. Every two successive cells in each row are separated by a single comma ‘,’symbol and every two successive rows are separated by a new-line ‘\n’ symbol. For example, the first table from the task statement to be saved in a CSV format is a single string ‘S. No., Name, Salary\n1,Niharika,50000\n2,Vivek,NULL\n3,Niraj,55000’ . The only assumption in this task is that each row may contain same number of cells.
Write a python function that converts the above string into the given format.
Write a function:
def Solution(s)
Given a string S of length N, returns the table without the Faulty rows in a CSV format.
Given S=‘S. No., Name, Salary\n1,Niharika,50000\n2,Vivek,NULL\n3,Niraj,55000’
The table with data from string S looks as follows:
After removing the rows containing the NULL values the table should look like this:
You can try a number of strings to cross-validate the function you have created.
Let’s begin.
First we will store the string in a variable s
Now we will start by declaring the function name and importing all the necessary libraries.
Creating a pattern to separate the string from ‘\n’ .
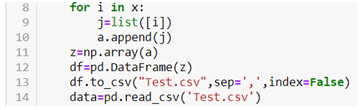
Creating a loop to create multiple lists within a list.
In the above code the list is converted to an array and then used to create a dataframe and stored as csv file in the default working directory.
Now we need to split the string to create multiple columns.
The above code creates a dataframe with multiple columns.
Now after dropping the rows with NaN values data looks like
To reset the index we can now use .reset_index() method.
Now the problem with the above dataframe created is that the NULL values are in string format, so first we need to convert them into NaN values and then only we will be able to drop them. For that we will be using the following code.
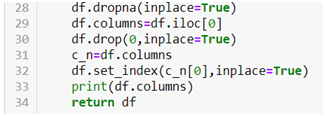
Now we will be able to drop the NaN values easily by using .dropna() method.
In the above code we first dropped the NaN values then we used the first row of the data set to create column names and then dropped the original row. We also made the first column as index.
Hence we have managed to create a function that can give us the above data. Once created this function can be used to convert a string into dataframe with similar pattern.
Hopefully, you found the discussion informative enough. For further clarification watch the video attached below the blog. To access more informative blogs on Data science using python training related topics, keep on following the Dexlab Analytics blog.
Here’s a video introduction to Automation. You can check it down below to develop a considerable understanding of the same:
As AI is gradually being incorporated into businesses, it is only a matter of time before the workplace dynamics get completely revolutionized. Despite there being a misconception that the adoption of AI only will spell disaster for the job market but, that is far from the truth. Yes, for handling repetitive tasks that require absolutely no human intervention might be entirely handled by the AI powered robots, but, there will be a requirement for people who have undergone artificial intelligence certification in delhi ncr. As the workplaces around us gear up to include AI in their regime, employees with AI training background would prove to be invaluable assets in the days to come.
How the workplace is being transformed by AI
AI could streamline workplace operations right from the hiring process. Finding the right candidate for any job means wading through a huge number of candidate profiles, scanning resumes, and then scheduling interviews. AI can automate the entire process by taking care of every single segment and could also engage with candidates and do the initial screening. Using a tool like Koru helps employers match candidate profiles to the job requirement and enables them to shortlist ideal candidates in a jiffy.
Post hiring the onboarding process could also be handled by AI by deploying chatbots that can help the new workers integrate with the existing system. AI-powered tools are also being incorporated to train the employees and personalized training programs could be developed as a result. A case in point would be Cogito, which monitors calls and offers suggestions to the customer support department to improve their conversations.
The employees usually have to go through carrying out some mundane tasks. It could be scheduling meetings, preparing reports, and also looking through reports to extract relevant information. This takes away all their time and energy which they otherwise could have utilized doing something productive. The inclusion of AI can take this mundane workload off the shoulders of the employees and automate the entire process. Another benefit to consider would be to identifying areas in the workplace that needs immediate attention, as well as identifying obstacles standing in the way of getting productive. LaborWise is an excellent productivity analytics tool.
Security is a key factor for any organization and given the rise in cybercrime, having access to cutting edge technology can prevent such threats. AI can rise to the occasion and help to identify threats analyzing scores of data in real-time. A great example of this would be DeepArmor, which is used for the prevention of malware. AI could easily detect anomaly which otherwise is impossible and could also explore previous datasets to identify areas that are vulnerable to such attacks. AI robots can also be used to handle hazardous work situations which could endanger a human worker.
Application of AI means that the organization would be empowered by cutting edge business knowledge. The accumulated data gets parsed quickly and employees get access to valuable information to devise the strategies accordingly. It saves time, it saves labor and most importantly it removes errors. The companies are quickly able to spot any changes in the pattern that needs immediate attention.
Be it the inclusion of RPA or, some other tool, AI is making workplaces function more efficiently and the future already sounds promising. However, the bias surrounding AI needs to be tackled and most importantly employees should be encouraged to upgrade themselves by enrolling in an artificial intelligence training institute in Gurgaon.
The world has finally woken up and smelled the power of data science and now we are living in a world that is being driven by data. There is no denying the fact that new technologies are coming to the fore that are born out of data-driven insight and numerous sectors are also turning towards data science techniques and tools to increase their operational efficiency.
This in turn is also pushing a demand for skilled people in various sectors who are armed with Data Science course or, Retail Analytics Courses to be able to sift through mountains of data to clean it, sort it and analyze it for uncovering valuable information. Decisions that were earlier taken often on the basis of erroneous data or, assumption can now be more accurate thanks to application of data science.
Now let’s take a look at which sectors are benefitting the most from data science
Healthcare
The healthcare industry has adopted the data science techniques and the benefits could already be perceived. Keeping track of healthcare records is easier not just that but digging through the pile of patient data and its analysis actually helps in giving hint regarding health issues that might crop up in near future. Preventive care is now possible and also monitoring patient health is easier than ever before.
The development in the field can also predict which medication would be suitable for a particular patient. Data analytics and data science application is also enabling the professionals in this sector to offer better diagnostic results.
Retail
This is one industry that is reaping huge benefits from the application of data science. Now sorting through the customer data, survey data it is easier to gauge the customers’ mindset. Predictive analysis is helping the experts in this field to predict the personal preference of the consumers and they are able to come up with personalized recommendations that is bound to help them retain customers. Not just that they can also find the problem areas in their current marketing strategy to make changes accordingly.
Transport
Transport is another sector that is using data science techniques to its advantage and in turn it is increasing its service quality. Both the public and private transportation services providers are keeping track of customer journey and getting the details necessary to develop personalized information, they are also helping people be prepared for unexpected issues and most importantly they are helping people reach their destinations without any glitch.
Finance
If so many industries are reaping benefits, Finance is definitely to follow suit. Dealing with valuable data regarding banking transactions, credit history is essential. Based on the data insight it is possible to offer customers personalized financial advice. Also the credit risk issue could be minimized thanks to the insight derived from a particular customer’s credit history. It would allow the financial institute make an informed decision. However, credit risk analytics training would be required for personnel working in this field.
Telecom
The field of telecom is surely a busy sector that has to deal with tons of valuable data. With the application of data science now they are able to find a smart solution to process the data they gather from various call records, messages, social media platforms in order to design and deliver services that are in accordance with customers’ individualistic needs.
Harnessing the power of data science is definitely going to impact all the industries in future. The data science domain is expanding and soon there would be more miracles to observe. Data Science training can help upskill the employees reduce the skill gap that is bugging most sectors.
This is the second part of the probability series, in the first segment we discussed the basic concepts of probability. In this second part we will delve deeper into the topic and discuss the theorems of probability. Let’s find out what these theorems are.
Addition Theorem
If A and B are two events and they are not necessarily mutually exclusive then the probability of occurrence of at least one of the two events A and B i.e. P(AUB) is given by
Removing the intersections will give the probability of A or B or both.
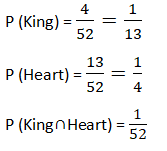
Example:- From a deck of cards 1 card is drawn, what is the probability the card is king or heart or both?
Total cards 52
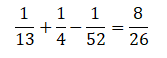
P(KingUHeart)= P(King)+P(Heart) ─ P(King∩Heart)
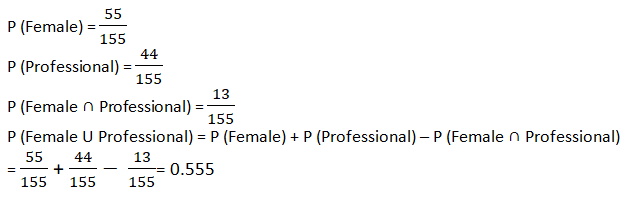
If A and B are two mutually exclusive events then the probability that either A or B will occur is the sum of individual probabilities of the events A and B.
P(A)+P(B), here the combined probability of the two will either give P(A) or P(B)
If A and B are two non mutually exclusive events then the probability of occurrence of event A is given by
Where B’ is 1-P(B), that means probability of A is calculated as P(A)=1-P(B)
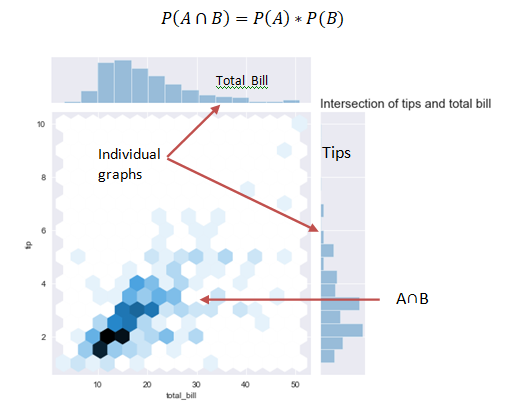
Multiplication Law
The law of multiplication is used to find the joint probability or the intersection i.e. the probability of two events occurring together at the same point of time.
In the above graph we see that when the bill is paid at the same time tip is also paid and the interaction of the two can be seen in the graph.
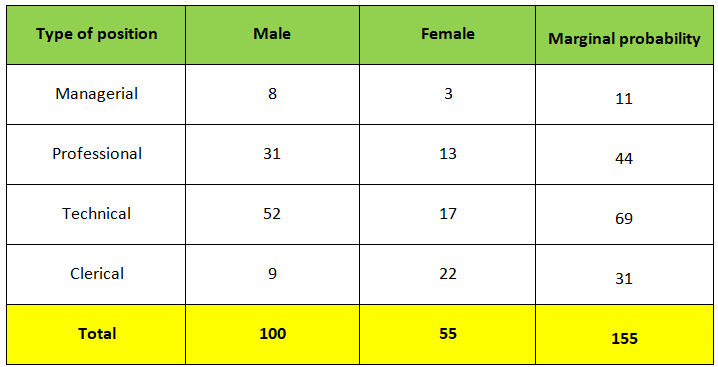
Joint probability table
A joint probability table displays the intersection (joint) probabilities along with the marginal probabilities of a given problem where the marginal probability is computed by dividing some subtotal by the whole.
Example:- Given the following joint probability table find out the probability that the employee is female or a professional worker.
Watch this video down below that further explains the theorems.
At the end of this blog, you must have grasped the basics of the theorems discussed here. Keep on tracking the Dexlab Analytics blog where you will find more discussions on topics related to Data Science training.
The job of a data scientist is one that is challenging, exciting and crucial to an organization’s success. So, it’s no surprise that there is a rush to enroll in a Data Science course, to be eligible for the job. But, while you are at it, you also need to have the awareness regarding the job responsibilities usually bestowed upon the data scientists in a business organization and you would be surprised to learn that the responsibilities of a data scientist differs from that of a data analyst or, a data engineer.
So, what is the role and responsibility of a data scientist? Let’s take a look.
The common idea regarding a data scientist role is that they analyze huge volumes of data in order to find patterns and extract information that would help the organizations to move ahead by developing strategies accordingly. This surface level idea cannot sum up the way a data scientist navigates through the data field. The responsibilities could be broken down into segments and that would help you get the bigger picture.
Data management
The data scientist, post assuming the role, needs to be aware of the goal of the organization in order to proceed. He needs to stay aware of the top trends in the industry to guide his organization, and collect data and also decide which methods are to be used for the purpose. The most crucial part of the job is the developing the knowledge of the problems the business is trying solve and the data available that have relevance and could be used to achieve the goal. He has to collaborate with other departments such as analytics to get the job of extracting information from data.
Data analysis
Another vital responsibility of the data scientist is to assume the analytical role and build models and implement those models to solve issues that are best fit for the purpose. The data scientist has to resort to data mining, text mining techniques. Doing text mining with python course can really put you in an advantageous position when you actually get to handle complex dataset.
Developing strategies
The data scientists need to devote themselves to tasks like data cleaning, applying models, and wade through unstructured datasets to derive actionable insight in order to gauge the customer behavior, market trends. These insights help a business organization to decide its future course of action and also measure a product performance. A Data analyst training institute is the right place to pick up the skills required for performing such nuanced tasks.
Collaborating
Another vital task that a data scientist performs is collaborating with others such as stakeholders and data engineers, data analysts communicating with them in order to share their findings or, discussing certain issues. However, in order to communicate effectively the data scientists need to master the art of data visualization which they could learn while pursuing big data courses in delhi along with deep learning for computer vision course. The key issue here is to make the presentation simple yet effective enough so that people from any background can understand it.
The above mentioned responsibilities of a data scientist just scratch the surface because, a data scientist’s job role cannot be limited by or, defined by a couple of tasks. The data scientist needs to be in synch with the implementation process to understand and analyze further how the data driven insight is shaping strategies and to which effect. Most importantly, they need to evaluate the current data infrastructure of the company and advise regarding future improvement. A data scientist needs to have a keen knowledge of Machine Learning Using Python, to be able to perform the complex tasks their job demands.
With 2.5 quintillion bytes of data being created everyday companies are scrambling to build models and hire experts to extract information hidden in massive unstructured datasets and the data scientists have become the most sought-after professionals in the world. The job portals are full of job postings looking for data scientists whose resume has the perfect combination of skill and experience. In this world which is being driven by the data revolution, achieving your big data career dreams need a little bit of planning and strategizing. So, here is a step-by-step guide for you.
Grabbing a high paying and skilled data job is not going to be easy, industries will only invest money on individuals with the right skillset. Your job responsibility will involve wading through tons of unstructured data to find pattern and meaning, making forecasts regarding marketing trends, customer behavior and deliver the insight in a presentable format to the company on the basis of which they are going to be strategizing.
So, before you even begin make sure that you have the tenacity and enthusiasm required for the job. You would need to undergo Data science using python training, in order to gain the necessary skills and knowledge and since this is an evolving field you should be ready to constantly upskill yourself and stay updated about the latest developments in the field.
Are you ready? If it’s a resounding yes, then, without wasting any more time let’s get straight to the point and explore the steps that will lead you to become a data scientist.
Step 1: Complete education
Before you pursue data science, you must complete your bachelors degree, if you are coming from computer science, applied mathematics, or, economics that could give you a head start. However, you need to undergo Data Science training, post that to acquire the required skillset.
Step 2: Gain knowledge of Mathematics and statistics
You do not need to have a PHD in either, but, since both are at the core of the data science you must have a good grasp on applied mathematics and statistics. Your task would require you to have knowledge regarding linear algebra, probability & statistics. So, your first step would be to update yourself and be familiar with the concepts if you happen to hail from a non-science background so that you can sail through the rest of the journey.
Step 3: Get ready to do programming
Just like mathematics and statistics, having a grip on a programming language preferably Python, is essential. Now, why do you need to learn coding? Well, coding is important as you have to work with large datasets comprising mostly unstructured data and coding will help you to clean, organize, read data and also process it. Now the stress is on Python because it is one of the widely used languages in the data science community and is comparatively easier to pick up.
Step 4: Learn Machine Learning
Machine learning plays a crucial role in data science as it helps finding patterns in data and making predictions. Mastering machine learning techniques would enable you develop algorithms for the models and create an automated system that enables you to make predictions in real-time. Consider undergoing a Machine Learning training gurgaon.
Step 5: Learn Data Munging, Visualization, and Reporting
It has been mentioned before that you would mostly be handling unstructured data, which means in order to process that data you must transform that data into a format that is easy to work with. Data munging helps you achieve that. Data visualization is again a must-have skill for a data scientist as it allows you to visually present your data findings that is easy to understand through graphs, charts, while data reporting lets you prepare and present reports for businesses.
Step 6: Be certified
Now that the field has advanced so much, there is a requirement for professionals who have undergone Data Science course. Doing a certification course would upskill you and arm you with industry knowledge. Reputed institutes like Dexlab Analytics offer cutting edge courses such as Python for data science training. If you just follow this step it would take care of the rest of the worries, the best part of getting your training is that here you will be taught everything from scratch so, no need to fret if you do not know programming language. Your learning would be aided by hands-on training.
Step 7: Practice your skills
You need to test the skills you have acquired and to hone the skills you must explore Kaggle, which lets your access resources you need and this platform also allows you to take part in competitions that further helps you sharpen your abilities. You should also keep on practicing by doing projects in order to put the theories into action.
Step 8: Work on your soft skills
In order to be a professional data scientist you must acquire soft skills as well. So along with working on your communication skills, you must also need to develop problem solving skills while learning how business organizations function to understand what would be required of you when you assume the role of a data scientist.
Step 9: Get an internship
Now that you have the skill and certification you need experience to get hired, build a resume stressing on the skills you have acquired and search the job portals to land an internship. It would not only enhance your resume, but, it also gives you exposures to real projects, the more projects you handle the better and you would also learn from the experts there.
Step 10: Apply for a job
Once you have gathered enough experience start applying for full-time positions as now you have both skill and experience. But, do not stop learning once you land a job, because this field is growing many changes will happen so you have to mold yourself accordingly. Be a part of the community, network with people, keep on exploring GitHub and find out what other skills you require.
So, those were the steps you need to follow to build a rewarding career in data science. The job opportunities are plenty and to grab the right job you must do big data training in gurgaon. These courses are aimed to prepare individuals for the industry, so get ready for an exciting career!
Today we will begin discussion about a significant concept, probability, which measures the likelihood of the occurrence of an event. This is the first part of the series, where you would be introduced to the core concept. So, let’s begin.
What is probability?
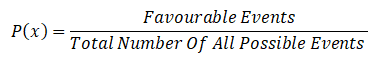
It is a measure of quantifying the likelihood that an event will occur and it is written as P(x).
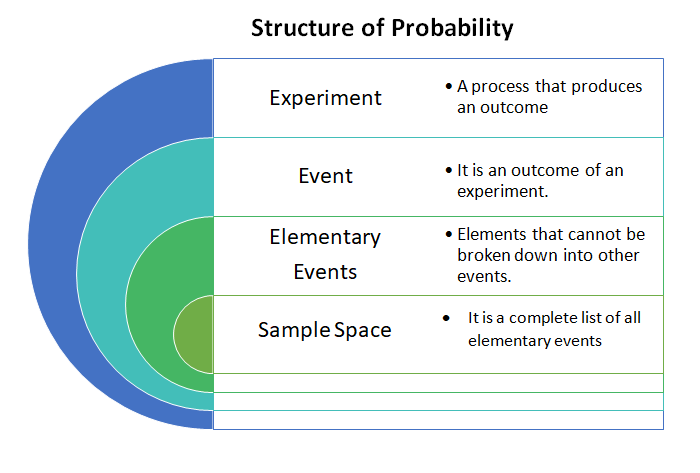
Key concepts of probability
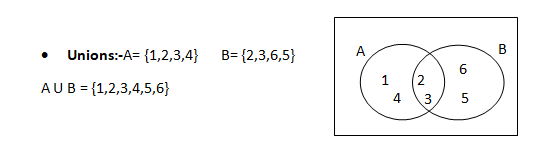
A union comprises of only unique values.
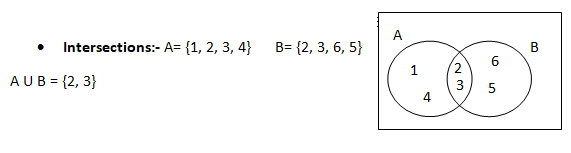
Intersection comprises of common values of the two sets
Mutually Exclusive Events:- If the occurrence of one event preludes the occurrence of the other event(s), then it is called mutually exclusive event.
P(A∩B) = 0
Independent Events:- If the occurrence or non-occurrence of an event does not have any effect on the occurrence or non-occurrence of other event(s), then it is called an independent event. For example drinking tea is independent of going for shopping.
Collectively Exhaustive Events:– A set of collectively exhaustive events comprises of all possible elementary events for an experiment. Therefore, all sample spaces are collectively exhaustive sets.
Complementary Events:– A complement of event A will be A` i.e. P(A`) = 1 ─ P(A)
Properties of probability
Probabilities are non-negative values ranging between 0 & 1.
Ω = 1 i.e. combined probability of sample is 1
If A & B are two mutually exclusive events then P(A U B)= P(A) +P(B)
Probability of not happening of an event is P(A)= 1 ─ P(A)
Rules of Counting the possibilities
The mn counting rule:- When a customer has a set of combinations to choose from like two different engines, five different paint colors and three different interior packages , how will he calculate the total number of options available to him? The answer to the question is “ mn counting rule”. Simply multiply the given options, like in our case 2 * 5 * 3 will give us 30.This means the customer has 30 combinations to choose from when it comes to purchasing a car.
Sampling from a population with replacement:- Suppose that you roll a dice three times i.e. the number of trials is 3, now if we want to check how many combinations are possible in this particular experiment we use Nn = 63 = 216
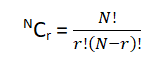
Sampling from a population without replacement:- When the sample space shrinks after each trial then you use the following formula :-
Conclusion
There is a video covering the same concept attached down the blog, go through it to be more clear about this.