Dexlab, Author at DexLab Analytics | Big Data Hadoop SAS R Analytics Predictive Modeling & Excel VBA - Page 17 of 18

Banking Business And Banking Instruments- Part 2

Banking Business And Banking Instruments- Part 2
 

In the last blog we had discussed three types of banking instruments, namely the Current account, Savings account and Certificate of Deposit.  In this blog we discuss credit cards. Credit cards are the most expensive and profitable type of loan that a bank can extend. A credit card is a card issued by a financial institution giving the holder an option to borrow funds, usually at points of scales. Credit cards charge interest and are primarily used for short-term financing. Interest usually begins one month after a purchase is made and borrowing limit is pre-set according to the individual’s credit rating. Credit cards have higher interest rates than most consumer loans, or lines of credit.

Continue reading “Banking Business And Banking Instruments- Part 2”

Quantitative Analysis 2 – Box Plot

As we discussed about the Five Number Summary in the earlier blog post, we will continue to explore the Five Number Summary using Box Plot. Box Plot helps an analyst to identify the distribution of a numeric variable across multiple categorical variables. Box Plot is a graphical representation of data that shows a data set’s lowest value, highest value, median value and the size of the first and third quartile.

In the below example, we are inputting the data into the Base SAS using a simple data step procedure. We are creating a dataset called Turbine that has an average power output on a daily basis.

Box Plot 1

SAS Code to input the data:

data Turbine;
informat Day date7.;
format Day date5.;
label KWatts=’Average Power Output’;
input Day @;
do i=1 to 10;
input KWatts @;
output;
end;
drop i;
datalines;
05JUL94 3196 3507 4050 3215 3583 3617 3789 3180 3505 3454
05JUL94 3417 3199 3613 3384 3475 3316 3556 3607 3364 3721
06JUL94 3390 3562 3413 3193 3635 3179 3348 3199 3413 3562
06JUL94 3428 3320 3745 3426 3849 3256 3841 3575 3752 3347
07JUL94 3478 3465 3445 3383 3684 3304 3398 3578 3348 3369
07JUL94 3670 3614 3307 3595 3448 3304 3385 3499 3781 3711
08JUL94 3448 3045 3446 3620 3466 3533 3590 3070 3499 3457
08JUL94 3411 3350 3417 3629 3400 3381 3309 3608 3438 3567
;
run;

SAS Code to plot Box Plot:

title ‘Box Plot for Power Output’;

proc boxplot data=Turbine;

plot KWatts*Day;

run;
SKEWS in the data:
The Box Plot not only helps you to find the Five Number Summary, you can also find which way the data is skewed.
You can see in the below Box Plot, the data for the day 05July is Right Skewed and the data for 08July is Left Skewed. You can plot a box plot for the sales data across every month in a year. You can find whether any Skewness in you sales data of a month by looking at the Box Plot. This can help you identify the variances and the data distribution for the sales.

The prime importance of using Box Plot and interpretation of data distribution is that Box Plot helps to read the data distribution across multiple series of categories. A single Box Plot can helps you to identify the data distribution rather than looking at single data distribution.
You can create a Box Plot by following the below code in R.
Boxplot(KWatts ~ Day, data=Turbine, main= “Box Plot for Power Output”, xlab = “Average Power Output”, ylab = “Days”)
R software gives lot of functions to play around the Box Plot with different colors. You can explore those options for better interpretation and the visual appealing for presenting your analysis.

Regulatory Stress Testing for the US Banks: Dodd-Frank Act Stress Test (DFAST) and Comprehensive Capital Analysis and Review (CCAR)

In the last blog we had discussed, at a very high level, the BASEL accords and their role in the dynamically changing landscape of risk analytics. These accords lay down the basic guidelines to ensure capital adequacy for the banking institutions against both expected and unexpected losses. Both expected and unexpected losses are manifestations of stress situations and testing the stability of a banking model under such adverse situations is indispensable from the regulatory perspective.  With this idea in mind, we discuss the very basic framework of two important regulatory documents on stress testing: Dodd-Frank Act Stress Testing (DFAST) and Comprehensive Capital Analysis and Review (CCAR).

Regulatory Stress Testing for the US Banks

Stress testing is a technique to test the stability of an entity or a system under adverse conditions. Two specific objectives of stress test are: (a) to identify the vulnerabilities in tranquil times and act as an early warning signal (b) to support crisis management and resolution.  Stress testing the financial institutions across the world has become inevitable after the 2008 Financial Crisis. This has been a tool extensively used by the Federal Reserve for evaluating the capital sufficiency of the US banks to absorb losses resulting from the stressful economic and financial market conditions.  The Dodd-Frank Act Stress Test (2010) and Comprehensive Capital Analysis and Review (2011) are two well-known stress testing  regulatory documents for the US Banking sector to comply with.

The Dodd-Frank Act Stress Test (DFAST) is a forward looking quantitative evaluation of the impact of stressful economic and financial market conditions on the capital of the Bank Holding Companies. It requires the Federal Reserve to conduct an annual stress test of large bank holding companies and all non-bank financial companies designated by the Financial Stability Oversight Council (FSOC). Bank Holding companies with total consolidated assets of $50 billion or more and non-bank financial companies designated for supervision by the board are subjected to annual supervisory stress test.  Under this act all financial companies with more than $10 billion in total consolidated assets that are supervised by Primary Federal Financial Regulatory Authority are required to conduct an annual company run stress test and also conduct a mid-cycle stress test under the company developed scenario.

The Comprehensive Capital Analysis Review (CCAR) evaluates a bank holding company’s capital adequacy, capital adequacy process, and planned capital distributions, such as dividend payments and common stock repurchases. As a part of CCAR, the Federal Reserve evaluates whether BHCs have adequate capital to continue operations throughout times of economic and financial market stress and whether they have robust, forward looking capital planning process that account for their unique risks. If the Federal Reserve objects to a BHCs Capital plan, the BHC may not make any capital allocation.  Mid-size and small-size firms need not go for CCAR process, but the large banks must be CCAR compliant. The banks which have participated in CCAR (2015) are: Bank of America, Citigroup, JP Morgan Chase, Wells Fargo, Goldman Sachs, Morgan Stanley, American Express, Bank of New York Mellon etc.

Though DFAST and CCAR may appear to be similar, because they both are supervisory stress test procedures. But, there are two major distinctions between the two: First, DFAST tries to assess the capital adequacy of a bank under adverse economic conditions, given their current dividend and share repurchase plans. CCAR, on the other hand,  tries to analyse the capital adequacy of the banks under adverse economic and market conditions, after taking into account the proposed capital plan of the bank in the next four quarters. Second, CCAR compliance for banks can result in having ‘a capped dividend policy’, if the Federal Reserve gives a ‘no pass’ to them. DFAST does not carry any such implications.

In our follow up blog to this one, we will discuss in details the procedure of regulatory stress testing and the different scenarios in which the stress test is conducted.

BASEL Accords: A Basic Understanding

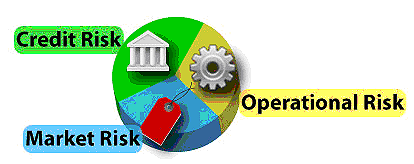
BASEL accords are a set of agreements set by the Basel Committee on Banking Supervision(BCBS) which provides recommendations on banking regulations in regard to credit risk, market risk and operational risk. The purpose of the accords is to ensure that the financial institutions have adequate capital on account to meet obligations and absorb unexpected loss. There are three versions of BASEL: BASEL-I, II and III. BASEL-I is relatively more simple compared to the later versions, in the sense that, its scope of definition of risk was limited only to credit risk. BASEL-II is a more advanced version of its predecessor in defining the scope and domain of banking risk. It points out three main areas of risks: Minimum Capital Requirements, Supervisory Review and market discipline. These are called the three pillars of BASEL. The focus of BASEL-II has been to strengthen the international banking requirements as well as to supervise and enforce these requirements. BASEL-III is the recent most version of the BASEL accords and most banks seeks compliance with it by the end of 2018. BASEL-III discusses the three pillars professed by BASEL-II in a more detailed manner by increasing the scope of the three pillars. In this blog we will discuss the three pillars of BASEL accords and the opportunities they generate in the analytics industry.

Pillar 1: Minimum Capital Requirements

BASEL-II emphasises that banks must have adequate capital to cover the three areas of risk exposure: Credit risk, Operational Risk and Market Risk. Credit risks are those which arise from the default on the loans made to obligors. The default occurs when obligors fail to make required payments. Operational Risk arises from failed internal processes. It includes legal risk, but excludes strategic and reputation risk. Market risks arise from losses on and off balance sheet position arising from movement in market prices. Statistical models are extensively used to develop predictive models for identifying the credit, operational and market risks. Probability of Default (PD), Loss given Default (LGD) and Exposure at Default (EAD) models are built to identify the inherent credit risk in the bank’s portfolio. Market risks are modelled using Value at Risk (VaR) and Economic Capital (ECAP) models. Building these models require a sound understanding of (i) the relevant business for which model development is done (ii) statistical techniques like Logistic Regression, Linear Regression, Time Series Analysis (both basic and advanced) (iii) segmentation techniques like CHAID, CART, Cluster analysis etc. and (iv) a very good understanding of soft wares like SAS, EXCEL and R.

Pillar 2: Supervisory Review

It provides with a framework to deal with risk related to systemic, pension, strategic, concentration, liquidity, legal and reputational. The accord combines all these risks under the title of residual risk. The aim of this pillar is to give better tools to the regulators. Black-Scholes-Merton of option pricing forms the basis of modeling for most of these risks (especially systemic risks). In order to develop this type of model you are required to have sound knowledge in terms of simulation Stochastic processes.

Pillar 3: Market Discipline

Market discipline supplements regulation as sharing of information facilitates assessment of the bank by others, including investors, analysts, customers, other banks, and rating agencies, which leads to good corporate governance. The aim of Pillar 3 is to allow market discipline to operate by requiring institutions to disclose details on the scope of application, capital, risk exposures, risk assessment processes, and the capital adequacy of the institution. It must be consistent with how the senior management, including the board, assess and manage the risks of the institution.

Banks require being compliant with all the three pillars of BASEL accords for prudently managing their risks. Hence Systematically Important Financial Institutions like Wells Fargo, HSBC, American Express, Bank of New York Mellon etc. look for resources with sound understanding of these pillars and the statistical knowledge required building models for their captive risk management process. Managing banking risk is perhaps the safest business to invest in as the extent of risks and regulatory compliance for banks are increasing overtime. Over the next few blogs we will try to understand the capital structures of banks and development of different BASEL compliant models for different pillars and capital tiers of banks.

Big Data at Autodesk: 360 Degree view of Customers in the Cloud

The last few years have seen a huge paradigm shift for many software vendors. The move away from a product-based model towards software-as-a-service (SAAS) in the cloud has brought huge changes. The main advantage of moving from a product based model to software-as-a-service is that the companies will be able to identify the service usage of how and why a product is being used. Earlier software companies used to run a survey or focus groups of customer feedback to identify the how and why a product is being used. This customer feedback survey has various limitations on identifying the product usage or where the product improvement has to be made.

Here’s All You Need to Know about Quantum Computing and Its Future

Autodesk was one of the frontrunners in the field, having been experimenting with the cloud based SAAS as far back as 2001 when it is acquired the BUZZSAW file sharing and synchronization service. Since then Microsoft, Adobe and many others moving into a subscription based, on-demand service and Autodesk has done the same with its core computer aided design products.

Software-as-a-service is a software licensing and delivery model in which software is licensed on a subscription basis and is centrally hosted. It is sometimes referred to as on-demand software. On-premise software is the exact opposite where the delivery of product is inside the particular organizations infrastructure.

Understanding how customers use a product is critical to giving them what they want. In a SAAS environment where everything is happening online and in the cloud, companies can gain a far more accurate picture  

2


The idea of moving to cloud based subscription model gives the business to understand more about the product usage of customers. This gives them the edge to serve better to the customers. The shift in the industry shall not be ignored. Big Data is really being used now to understand how and where to improve the product.


The Indian IT industry is focusing mainly on Cloud, Analytics, Mobile and Social segment to further drive growth. This Software-as-a-service delivery model can certainly give the edge to do data analysis on where and how the product is used.


There are number of reasons why Software-as-a-service is beneficial to organizations:


  • No additional hardware costs, you can buy the processing power or hardware as per the requirement. Do not have to go for high end configuration as there is no requirement. Need based subscription.
  • Usage is scalable. You can scale whenever you require.
  • Applications can be customised.
  • Accessible from any location, rather than being restricted to installations on individual computers an application can be accessed from anywhere with an internet enabled device.


The adoption of cloud based delivery model is accelerating mainly because of the analytical capability it gives the business to understand the customers. Analytics rocks!.


For state of the art big data training in Pune, look no further than DexLab Analytics. It is a renowned institute that excels in Big data hadoop certification in Pune. For more information, visit their official site.


Interested in a career in Data Analyst?

To learn more about Machine Learning Using Python and Spark – click here.
To learn more about Data Analyst with Advanced excel course – click here.
To learn more about Data Analyst with SAS Course – click here.
To learn more about Data Analyst with R Course – click here.
To learn more about Big Data Course – click here.

Import and Export of dataset using SAS and R

Import and Export of dataset using SAS and R
 

For an analyst, data is a primary raw material, which is used to draw conclusions and inferences for taking business decisions. Raw data is of less help to draw conclusions and inferences. Hence, we need to put the data into any statistical analysis software to slice and dice to bring inference for better decision making. In this post, we will discuss about the steps to import and export of a dataset using SAS and R.

Continue reading “Import and Export of dataset using SAS and R”

How Vital Is It to Measure KPIs for Future Success

How Vital Is It to Measure KPIs for Future Success

As I discussed earlier, Analytics is highly quantitative in nature. In this blog, we will discuss about the importance of Key Performance Indicators and how does KPIs help in measuring the organization’s performance and analytics.

Continue reading “How Vital Is It to Measure KPIs for Future Success”

Credit Risk Analytics and Regulatory Compliance – An Overview

Credit Risk Analytics and Regulatory Compliance – An Overview


Post the Financial Crisis of 2008, there has been an increase in the regulatory vigilance of the capital adequacy of commercial banks across the globe. Banks need to be compliant with different regulatory capital requirements, so that they can continue their operations under situations of stress. A majority of analytical work in Indian BFSI domain is to provide analytical support to US based multinational NBFC’s. We would like to throw some light on the opportunities and scope of credit risk analytics in the US banking and financial services industry. The Federal Reserve requires the banks to be compliant with three main regulatory requirements: BASEL- II, Dodd Frank Act Stress Testing (DFAST) and Comprehensive Capital Analysis and Review (CCAR).

Continue reading “Credit Risk Analytics and Regulatory Compliance – An Overview”

Quantitative Analysis 1 – Five Number Summary

To be a successful analyst or be a part of great analytics team, there are 3 important dimensions one would aspire to be or have. They are technical, business and tools. Hence, we would begin with one of the sub dimension of the technical skills, i.e. being quantified self or developing quantitative skills.

 Quantitative Analysis 1 – Five Number Summary

As per the Informs, the definition of Analytics shall be:

  Continue reading “Quantitative Analysis 1 – Five Number Summary”

Call us to know more