Today we are going to learn about the new releases from Scikit-learn version 0.22, a machine learning library in Python. First we learn how to install it on our systems. Then, we come to the much talked about new release called stacking regression.
Now, how does stacking regression work? Well, you have been using machine learning algorithms like Decision Tree or Random Forest. Have you heard of Voter Classifier? It is an algorithm in Scikit-learn. Ensemble algorithm is a combination of two or more algorithms to make it stronger.
When working on a set of data, we must apply all these algorithms to get predicted values. Then we vote out classified predicted values in Voter Classifier. Stacking Classifier is different. What we are doing in it is stacking together the predicted values to make a new input.
Initially, we make prediction by using various algorithms separately. Their results or output are then concatenated together. Then we use this output as a new input and apply the algorithms to it to get target variable. This method is known as stacking regression.
We try this out on a data set that can be taken from a github repository the link to which is given below.
Then we use two algorithms as estimators. Then we use stacking regression to build a model. For more on this do watch the video attached herewith. This tutorial was brought to you by DexLab Analytics. DexLab Analytics is a premiere Machine Learning institute in Gurgaon.
Data Science has undergone a tremendous change since the 1990s when the term was first coined. With data as its pivotal element, we need to ask valid questions like why we need data and what we can do with the data in hand.
The Data Scientist is supposed to ask these questions to determine how data can be useful in today’s world of change and flux. The steps taken to determine the outcome of processes applied to data is known as Data Science project lifecycle. These steps are enumerated here.
Business Understanding
Business Understanding is a key player in the success of any data science project. Despite the prevalence of technology in today’s scenario it can safely be said that the “success of any project depends on the quality of questions asked of the dataset.”One has to properly understand the business model he is working under to be able to effectively work on the obtained data.
Data Collection
Data is the raison detre of data science. It is the pivot on which data science functions. Data can be collected from numerous sources – logs from webservers, data from online repositories, data from databases, social media data, data in excel sheet format. Data is everywhere. If the right questions are asked of data in the first step of a project life cycle, then data collection will follow naturally.
Data Preparation
The available Data set might not be in the desired format and suitable enough to perform analysis upon readily. So the data set will have to be cleaned or scrubbed so to say before it can be analyzed. It will have to be structured in a format that can be analyzed scientifically. This process is also known as Data cleaning or data wrangling. As the case might be, data can be obtained from various sources but it will need to be combined so it can be analyzed.
For this, data structuring is required. Also, there might me some elements missing in the data set in which case model building becomes a problem. There are various methods to conduct missing value and duplicate value treatment.
“Exploratory Data Analysis (EDA) plays an important role at this stage as summarization of clean data helps in identifying the structure, outliers, anomalies and patterns in the data.
These insights could help in building the model.”
Data Modelling
This stage is the most, we can say, magical of all. But ensure you have thoroughly gone through the previous processes before you begin building your model. “Feature selection is one of the first things that you would like to do in this stage. Not all features might be essential for making the predictions. What needs to be done here is to reduce the dimensionality of the dataset. It should be done such that features contributing to the prediction results should be selected.”
“Based on the business problem models could be selected. It is essential to identify what is the task, is it a classification problem, regression or prediction problem, time series forecasting or a clustering problem.” Once problem type is sorted out the model can be implemented.
“After the modelling process, model performance measurement is required. For this precision, recall, F1-score for classification problem could be used. For regression problem R2, MAPE (Moving Average Percentage Error) or RMSE (Root Mean Square Error) could be used.”The model should be a robust one and not an overfitted model that will not be accurate.
Interpreting Data
This is the last and most important step of any Data Science project. Execution of this step should be as good and robust as to produce what a layman can understand in terms of the outcome of the project.“The predictive power of the model lies in its ability to generalise.”
The first case of the 2019-2020 Coronavirus pandemic in India was reported on January 30, 2020, originating in China. Experts suggest the number of infections could be much higher as India’s testing rates are among the lowest in the world. The infection rate of COVID-19 in India is 1.7, significantly lower than in the worst affected countries.
The World Health Organisation chief executive director of health emergencies program Michael Ryan said that India has “tremendous capacity” to deal with the coronavirus outbreak, and as the second most populous country, will have enormous impact on the world’s ability to deal with it.
DexLab Analytics, in the first part of this blog series, studied the statewise breakup of COVID-19 cases in India through a Jupyter Notebook. Libraries were called, maps were drawnand data was taken from Kaggle.
The data and code sheet can be found below.
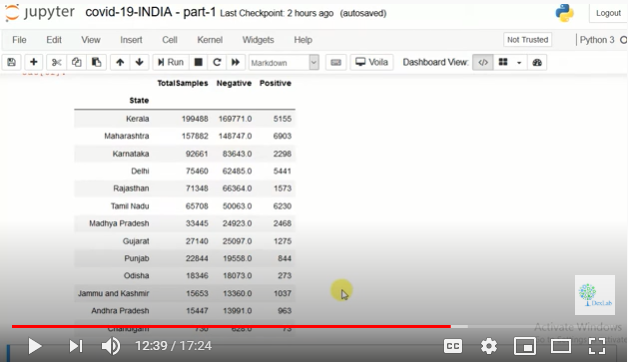
In this part of the blog series we will study how states are performing with regard to laboratories and testing. First we make three data sets – that of confirmed cases, recovered cases and cases of deaths.
We first plot this data on a graph and study it carefully. Then we make a pivot table and study the data. We then also study which state is performing how many tests on people. Kerala is found to have done the maximum number of tests (Fig.1.).
Fig. 1.
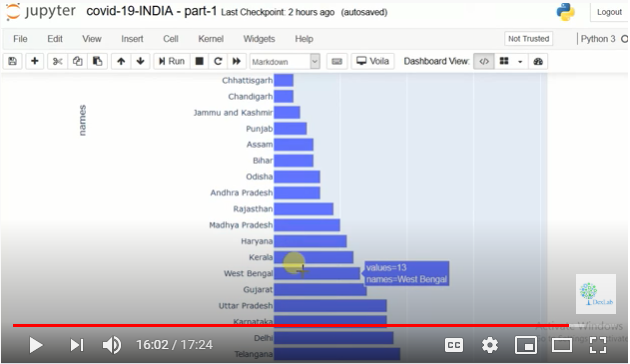
The purpose of this video is to teach you how to use visual graphs in Python. Now we aim to find why testing is underdone in states. Is there a possibility of a lesser number of labs in the first place? We get a graph (Fig. 2.) that shows us how many labs each state has for testing COVID-19 samples.
The first case of the 2019-2020 Coronavirus pandemic in India was reported on January 30, 2020, originating in China. Experts suggest the number of infections could be much higher as India’s testing rates are among the lowest in the world. The infection rate of COVID-19 in India is 1.7, significantly lower than in the worst affected countries.
The World Health Organisation chief executive director of health emergencies program Michael Ryan said that India has “tremendous capacity” to deal with the coronavirus outbreak, and as the second most populous country, will have enormous impact on the world’s ability to deal with it.
Other commentators worried about the economic devastation caused by the lockdown that has huge effects on informal workers, micro and small enterprises and farmers and self employed people who are left without a livelihood in the absence of transportation and access to markets.
The lockdown was justified by the government and other agencies for being pre-emptive to prevent India from entering a higher stage which could make handling very difficult and cause even more losses thereafter. According to a study by Shiv Nadar University, India could have witnesses a surge of 31,000 cases between March 24 and April 14 without lockdown.
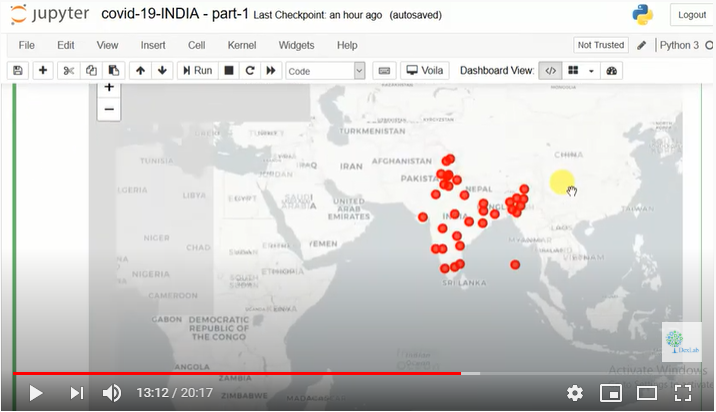
So we call a Jupyter Notebook in Python to study India’s COVID-19 story.
The data and code sheet used in this study can be found below.
We will first import all libraries like pandas and numpy. All the data has been taken from kaggle. We then take the data and work a dataframe on it. And then we generate an India map to study the spread of SARS-CoV-2.
Chatbots or “conversational agents” are software applications that mimic or imitate written or spoken human speech for the purposes of facilitating a conversation or interaction with a human being.
These applications have become one of the most ubiquitous software applications out there with the advancement of machine learning technology and NLP.
“Today’s chatbots are smarter, more responsive, and more useful – and we’re likely to see even more of them in the coming years… chatbots are used most commonly in the customer service space, assuming roles traditionally performed by living, breathing human beings such as Tier-1 support operatives and customer satisfaction reps.”
Conversational agents are becoming a common occurrence partly due to the fact that barriers to entry in creating chatbots such as sophisticated programming knowledge have become redundant.
How Chatbots work
The crux of chatbot technology is natural language processing or NLP, the same technology “that forms the basis of the voice recognition systems used by virtual assistants such as Google Now, Apple’s Siri, and Microsoft’s Cortana.” “Chatbots process the text presented to them by the user…infer what they mean and/or want, and determine a series of appropriate responses based on this information.”
Here are 5 companies using chatbots for various roles like marketing, communicating with marginalized groups and patients suffering from sleeplessness and memory loss.
Endurance
Russian technology company Endurance developed a companion chatbot to help dementia patients cope with decreased verbal ability. Many patients with Alzheimer’s disease use the chatbot to converse with. In turn, the chatbot identifies deviations in conversational patterns of the patient that might indicate a problem with memory and recollection.
Casper
Casper’s Insomnobot 3000 is a conversational agent that aims to help insomniacs by posing as a companion to talk to while the rest of the world sleeps. However, at this point, “Insomnobot 3000 is a little rudimentary.”
UNICEF
International child advocacy nonprofit UNICEF is using chatbots to help people living in developing countries speak out about the most urgent needs in their communities. The bot, named U-Report, focuses on large-scale data gathering via polls. UNICEF then uses feedback as the basis for potential policy recommendations.
MedWhat
This chatbot aims at making medical diagnoses faster, easier, and more transparent for both patients and physicians. MedWhat is powered by a highly sophisticated machine learning system that offers increasingly accurate responses to user questions based on behaviors that it “learns” by interacting with human beings. Also, it acts as a repository of a vast source of medical journals and medical advice.
Roof Ai
Roof Ai is a chatbot that helps real-estate marketers to “automate interacting with potential leads and lead assignment via social media”. The bot identifies potential leads via social media and responds immediately, irrespective of the time of the day. “Based on user input, Roof Ai prompts potential leads to provide a little more information, before automatically assigning the lead to a sales agent.”
Unlike India’s healthcare system wherein both public and private entities deliver healthcare facilities to citizens, in the US, the healthcare sector is completely privatised.
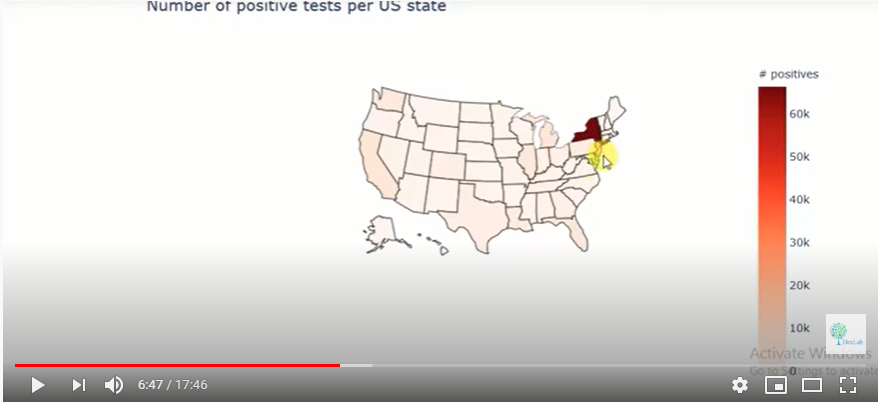
The aim of this notebook is to study some of the numerical data we have for the US and especially data for New York. Most of us know about New York’s situation that is one of the worst in the world.
Therefore, analysing data may clarify a few things. We will be using three sets of data – urgent care facilities, US county healthcare rankings 2020 and Covid sources for counties.
For the data and codesheet click below.
Now pick key column names for your study with ‘.keys’ as the function name. We are interested in a few variables from health rankings so we take only the ones we think will be useful in a new data frame.
We will study each data set one by one so that we can get an understanding of the data before combining them. For this we call the plotly library that has very interactive graphs. We use the choropleth to generate a heat map over the country in question.
Fig. 1.
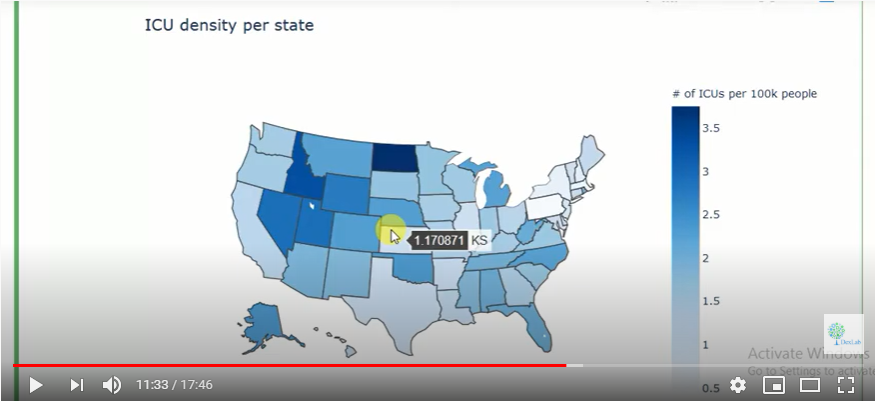
It is clear form the heat map that New York has a very high incidence of infections vis a vis other states. We then begin working with data on the number of ICU beds in each state. Since each state will have different populations, we cannot compare the absolute number of ICU beds. We need the ratio of ICU beds per a given number of inhabitants.
Fig. 2.
The generated heat map (Fig. 2.) shows the ICU density per state in the US. For more on this do watch the complete video tutorial attached herewith.
This video tutorial is on exploratory data analysis. The data is on COVID-19 cases and it has been taken from Kaggle. This tutorial is based on simple visualization of COVID-19 cases.
For code sheet and data click below.
Firstly, we must call whatever libraries we need in Python. Then we must import the data we will be working on onto our platform.
Now, we must explore PANDAS. For this it is important to know that there are three types of data structures – Series, Data Frame and Panel Data. In our tutorial we will be using data frames.
Fig. 1.
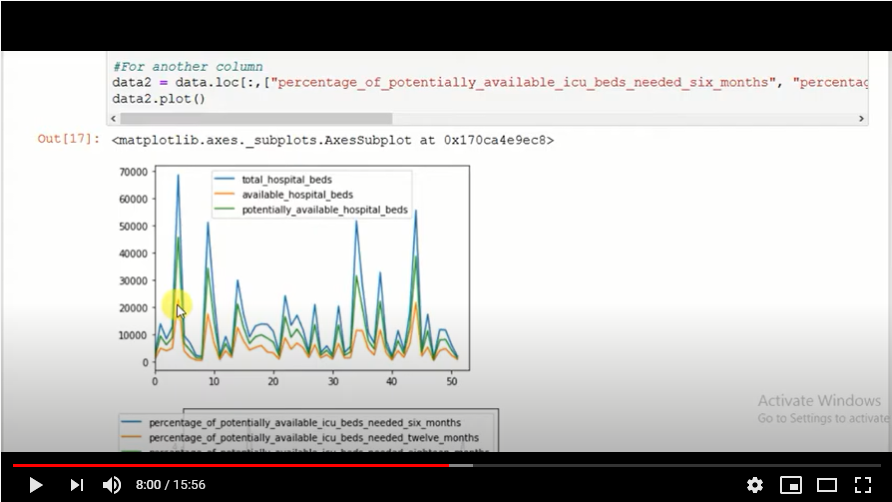
Now we will plot the data we have onto a graph. When we run the program, we get a graph that shows total hospital beds, potentially available hospital beds and available hospital beds.
Fig. 2.
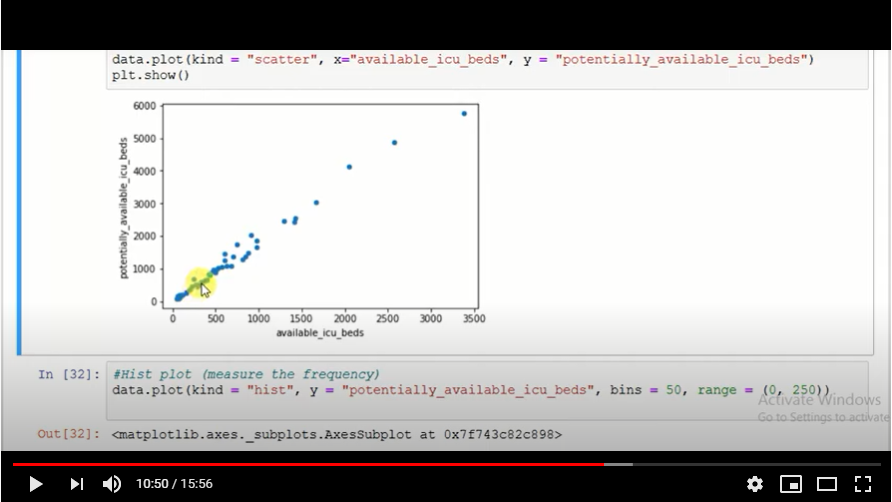
While visualizing data we must remember to keep the data as simple as possible and not make it complex. If there are too many data columns the interpretation will be a very complex one, something we do not want.
Fig. 3.
A scatter plot (Fig. 3.) is also generated to show the reading of the data available. We study the behaviour of the data on the plot.
When a lender starts a financial institution with the aim of lending money to entities, he is most strongly fortified against credit risk. He undertakes several measures to lower credit risk and this is called credit risk modelling.
“A good credit risk assessment can prevent avoidable losses for an organization. When a borrower is found to be a debtor, it could dent their creditworthiness. The lender will be skeptical about offering loans for fear of not getting it back,” says a report.
Credit risk assessment is done to gauge whether a borrower can pay back a loan. The credit risk of a consumer is determined by the five Cs – capacity to repay, associated collateral, credit history, capital, and the loan’s conditions.
“If a borrower’s credit risk is high, their loan’s interest rate will be increased. Credit risk shows the likelihood of a lender losing their loaned money to a borrower.”Credit risk highlights a borrower’s ability to honour his contractual agreements and repay loans.
“Conventionally, it deals with the risk every lender must be familiar with, which is losing the principal and interest owed. The aftermath of this is a disturbance to the lender’s cash flow and the possibility of losing more money in a bid to recover the loan.”
Credit Risk Modelling
While there is no pronounced way to determine the credit risk of an individual, credit risk modeling is an instrument that has largely come to be used by financial institutions to accurate measure credit risk.
“Credit risk modeling involves the use of data models to decide on two important issues. The first calculates the possibility of a default on the part of a loan borrower. The second determines how injurious such default will be on the lender’s financial statement.”
Financial Statement Analysis Models
Popular examples of these models include Moody’s RiskCalc and Altman Z-score. “The financial statements obtained from borrowing institutions are analyzed and then used as the basis of these models.”
Default Probability Models
The Merton model is a suitable example of this kind of credit risk modeling. The Merton model is also a structural model. Models like this take into account a company’s capital structure “because it is believed here that if the value of a company falls below a certain threshold, then the company is bound to fail and default on its loans”.
Machine Learning Models
“The influence of machine learning and big data on credit risk modeling has given rise to more scientific and accurate credit risk models. One example of this is the Maximum Expected Utility model.”
The 5Cs of Credit Risk Evaluation
These are quantitative and qualitative methods adopted for the evaluation of a borrower.
Character
“This generally looks into the track record of a borrower to know their reputation in the aspect of loan repayment.”
Capacity
“This takes the income of the borrower into consideration and measures it against their recurring debt. This also delves into the borrower’s debt-to-income (DTI) ratio.”
Capital
The amount of money a borrower is willing to contribute to a potential project can determine if the lender will lend him money.
Collateral
“It gives the lender a win-win situation, in the sense that upon a default, the lender can sell the collateral to recover the loan.”
Conditions
“This takes information such as the amount of principal and interest rate into consideration for a loan application. Another factor that can be considered as conditions is the reason for the loan.”
Conclusion
There is no formula anywhere that exposes the borrower who is going to default on loan repayment. However, the proper assessment of credit risk can go a long way in reducing the impact of a loss on a lender. For more on this, do visit the DexLab Analytics website today. DexLab Analtyics is a premiere institute that provides credit risk analysis courses online.
The COVID-19 pandemic has hit us hard as a people and forced us to bow down to the vagaries of nature. As of April 29, 2020, the number of persons infected stands at 31,39,523 while the number of persons dead stands at 2,18,024 globally.
This essay is on the phenomenon of detecting geographical variations in the mortality rate of the COVID-19 epidemic. This essay explores a specific range of latitudes along which a rapid spread of the infection has been detected with the help of data sets on Kaggle. The findings are Dexlab Analytics’ own. Dexlab Analytics is a premiere institute that trains professionals in python for data analysis.
For the code sheet and data used in this study, click below.
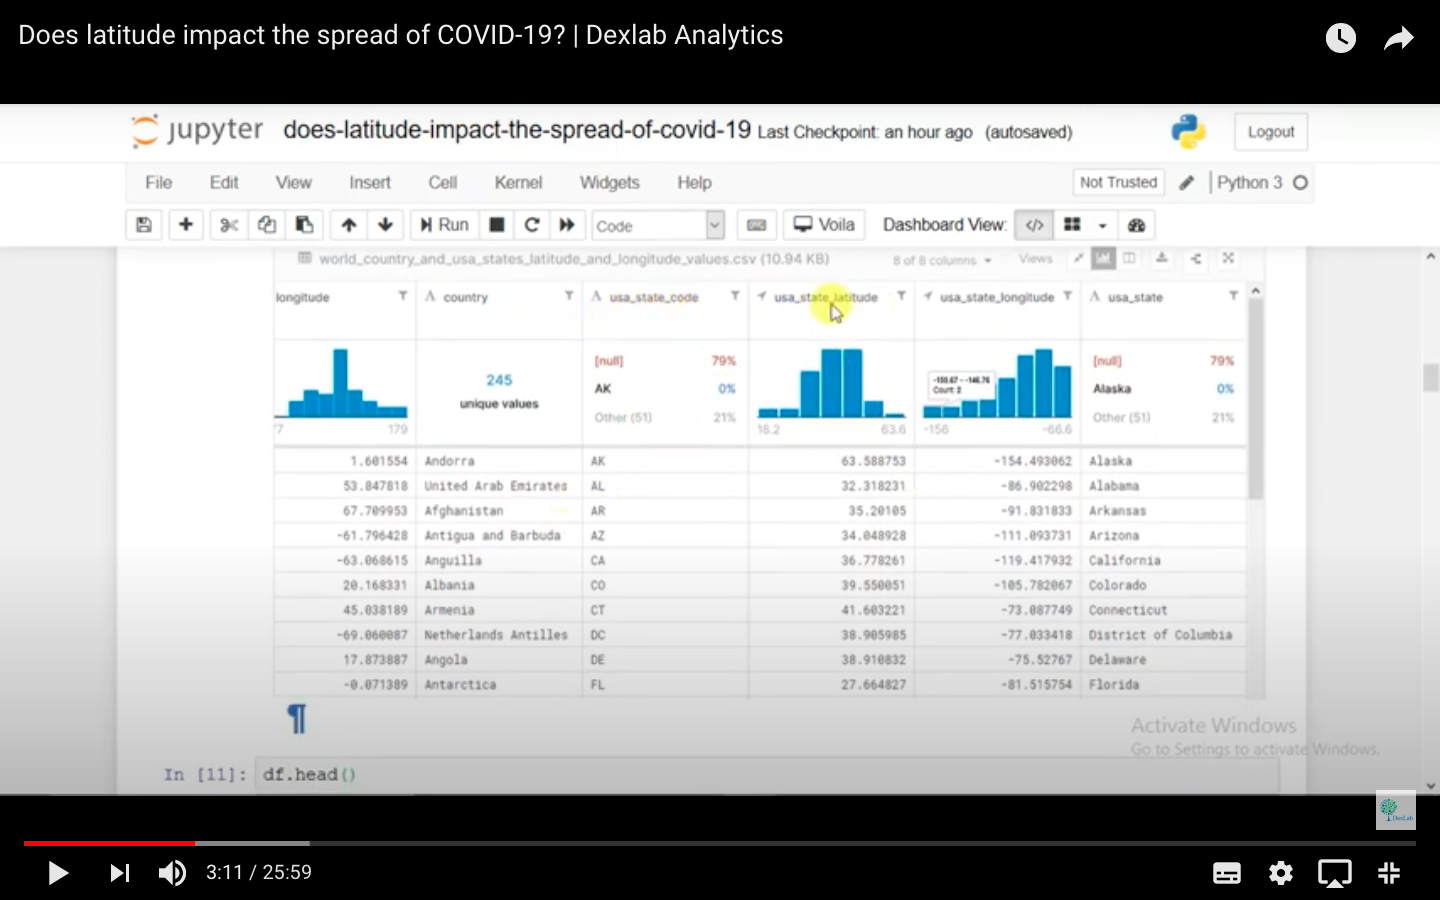
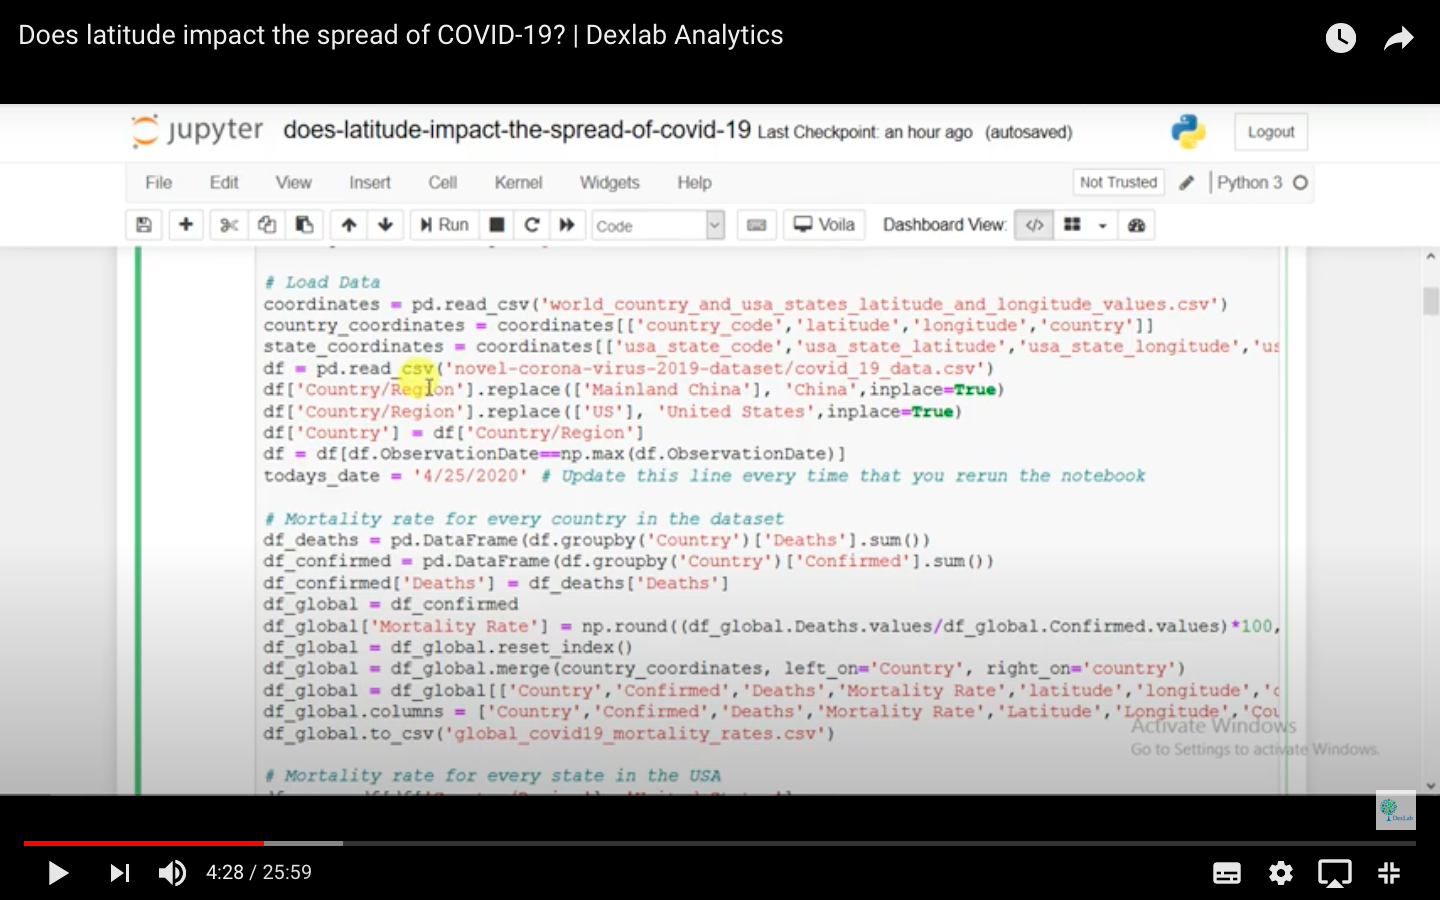
The instructor has imported all Python libraries and the visualisation of data hosted on Kaggle has been done through a heat map. The data is listed on the basis of country codes and their latitudes and there is a separate data set based on the figures from the USA alone.
Fig. 1.
The instructor has compared data from amongst the countries in one scenario and among states in the USA in another scenario. Data has been prepared and structured under these two heads.
Fig. 2.
The instructor has prepared the data according to the mortality rate of each country and it is updated to the very day of working on the data, i.e. the latest updated figures are presented in the study. When the instructor runs the program, a heat map is produced.
For more on this, do go through the half-an-hour long program video attached herewith. The rest of the essay will be featured in subsequent parts of this series of articles.