This blog is in continuation of STATISTICAL APPLICATION IN R & PYTHON: CHAPTER 1 – MEASURE OF CENTRAL TENDENCY and takes you through a comprehensive way to calculate the Median in R and Python.
The term ‘Median’ is derived from the Latin word – ‘Medius’ means the center of something. In mathematics, Median is treated is that unique observation which would divide your data set into two equal halves.
If you are still unclear about Mean and/or seeking easier ways to calculate Mean using R & Python, then check APPLICATION OF HARMONIC MEAN USING R AND PYTHON and CALCULATING GEOMETRIC MEAN USING R AND PYTHON.
Median is special because unlike its rival, the Mean, Median is not ridiculed by the curse of extreme values. To illustrate the curse of extreme values, we bring you the following example:
Imagine I had the following data about the average annual salaries:
In Lacs
8.5 | 9 | 11 | 7 | 8 | 8.5 | 36 |
The mean of the above data set is: 88/7 = 12.57 lacs.
Whereas, to get the median we would have to first arrange the data into ascending order and look for the midpoint of my data i.e.,(1/2 + n/2)th observation. Where “n” is the number of observations.
The median would then be:
7 | 8 | 8.5 | 8.5 | 9 | 11 | 36 |
Median is the 4th observation, which is 8.5 lacs.
Looking at the mean and median, it would be fair to conclude that median is the better choice to accurate summarizing the data set whenever extreme values are present. However, this may be a crude generalization which should be taken with a pinch of salt. Despite its flaws, the mean still has statistical properties used in predictive analytics which the median lacks.

Application:
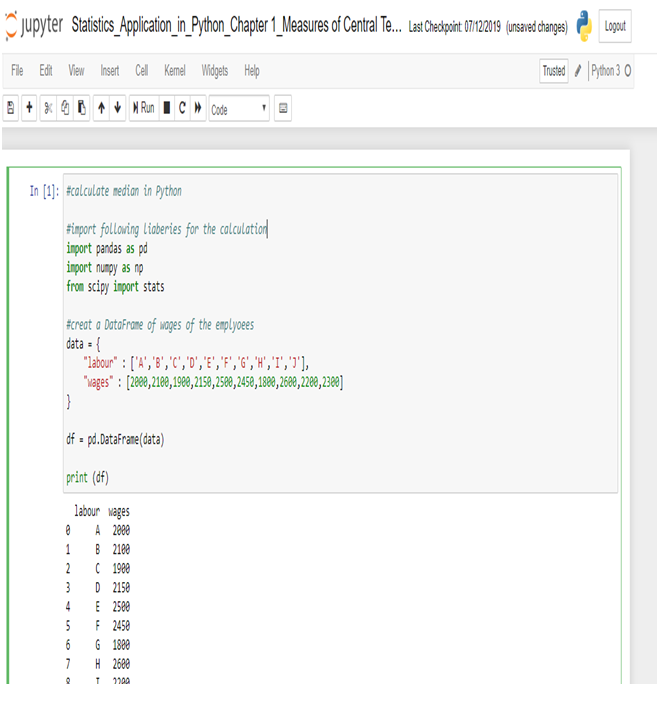
A construction company gave wages to their 10 labor (Let name A to J) as a weekly basis, the wages are 2000, 2100, 1900, 2150, 2500, 2450, 1800, 2600, 2200, 2300. Compute the Median wages of the construction company.
| Sr.No | Labors | Wages (Weekly) |
|---|---|---|
| 1 | A | 2000 |
| 2 | B | 2100 |
| 3 | C | 1900 |
| 4 | D | 2150 |
| 5 | E | 2500 |
| 6 | F | 2450 |
| 7 | G | 1800 |
| 8 | H | 2600 |
| 9 | I | 2200 |
| 10 | J | 2300 |
Calculation Median in R:
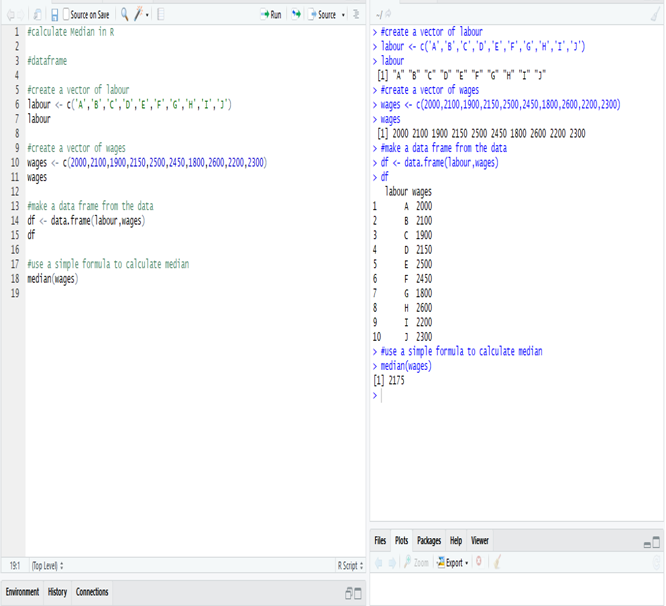
The Median wage is 2175, calculate in R.
Calculate Median in Python:
Create a data frame of the data in Python.
Now, calculate Median in Python.
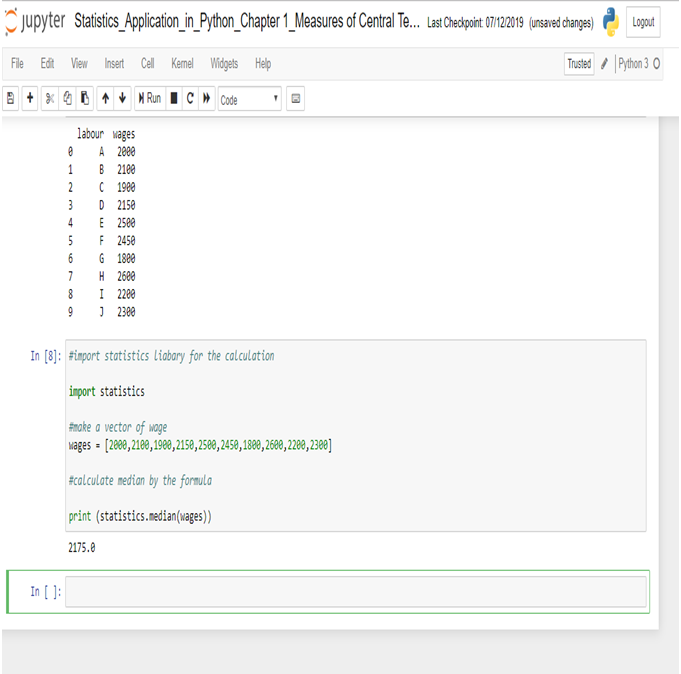
The Median wage is 2175, calculated in R.
This concludes the post. If you have any queries with regards to this post, you can reach us at Dexlab Analytics. Furthermore, you can also look up for interesting and quality courses of R Programming Certification, Python Certification. Also, you can enroll with us for our combined courses of Data Science with Python Certification, Deep Learning and AI using Python, among others. So, hurry up and grab the best course!
Interested in a career in Data Analyst?
To learn more about Data Analyst with Advanced excel course – Enrol Now.
To learn more about Data Analyst with R Course – Enrol Now.
To learn more about Big Data Course – Enrol Now.To learn more about Machine Learning Using Python and Spark – Enrol Now.
To learn more about Data Analyst with SAS Course – Enrol Now.
To learn more about Data Analyst with Apache Spark Course – Enrol Now.
To learn more about Data Analyst with Market Risk Analytics and Modelling Course – Enrol Now.
Python certification, python certification course, Python courses, R language training, R Programming, R programming certification, R Programming Training, R Programming Training course, R programming training institute, R programming using Python, Software tools : SAS, R, Python etc