There are a handful of decisions that seldom wrap people in mind-boggling conundrum – whether to take the job or not, to get married or not and to choose between Batman and Superman for Halloween costume!
For a data analyst, there is an easy way out all we need is a bigger boat and when we say boat, we mean efficient analytical software. Let us dive right into the data of it all and determine which superhero to smart for our Halloween shindig.
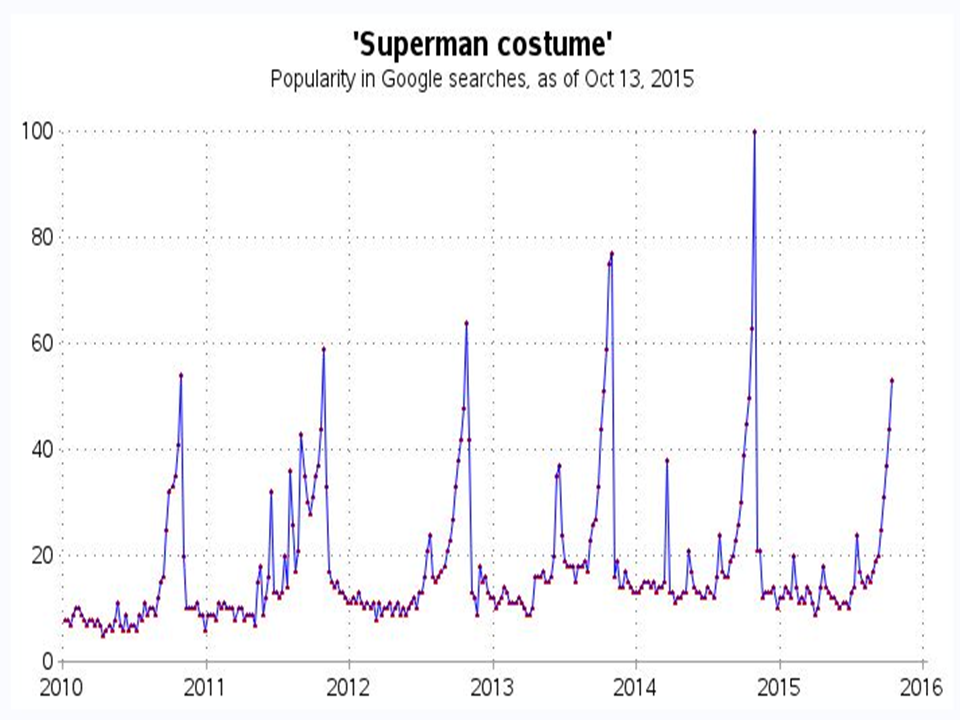
Let us begin with Superman, this character has been around for the longest, since 1933 and has been a popular character for many years.
Now for the analysis part, for the data gathering we took to Google Trends and ran a keyword search on the words – superman-costume. The data we saved as a CSV text file and then used a data step to read it into our SAS program. After that the steps were pretty simple and involved using Proc Gplot to make the plot of past 5+ years of data. On doing so, we gathered that the interest in Superman costumes increases at Halloween every year and has a pattern of increment in the past 5 years.
Here is a graph showcasing that:
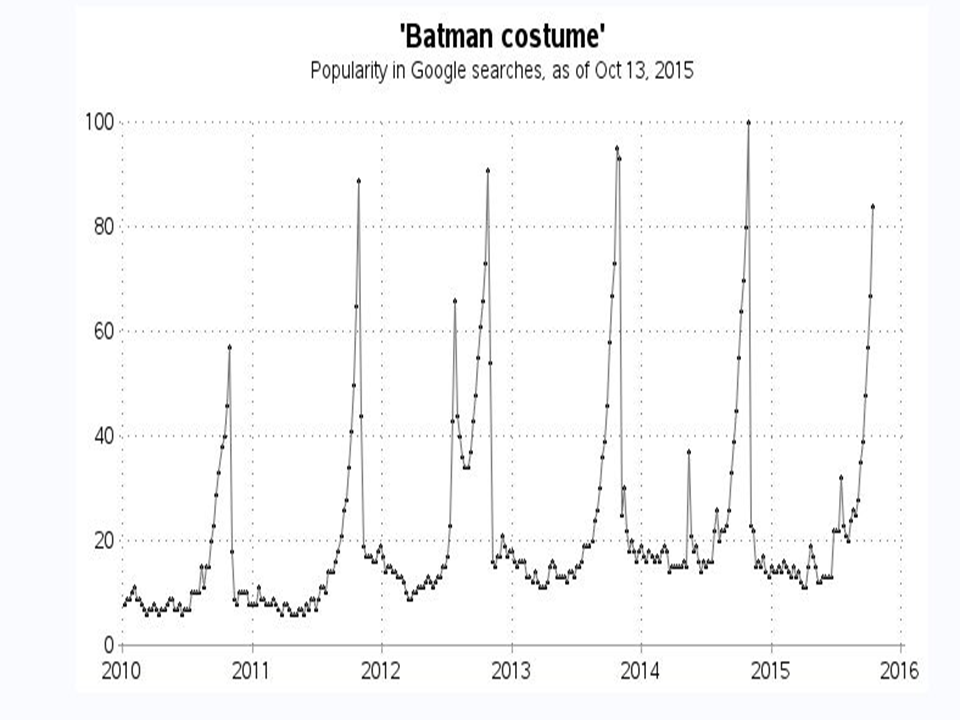
Now let us understand the data trends of Batman, Batman has also been around since 1939 and the Google trend for batman costume also follows the same general trend of yearly pattern as the superman costumes. However, the interest has been quite high since the past few years, or to be precise for the past 4 years without the gradual increment in demand for every year like the Superman graph.
All this seem fine, but how can we compare both these graphs? And what does this rating of 0-100 mean? Reading the details on the Google search page we found that they always make the graphs go from 0-100 and scale the available data in such a way that 100 corresponds to the maximum value. Hence, to compare the Superman vs. Batman costumes we must conduct a Google-Trend search for both of these at the same time, thus, the numeric values will both be of the same scale and below is the result of that combined search:
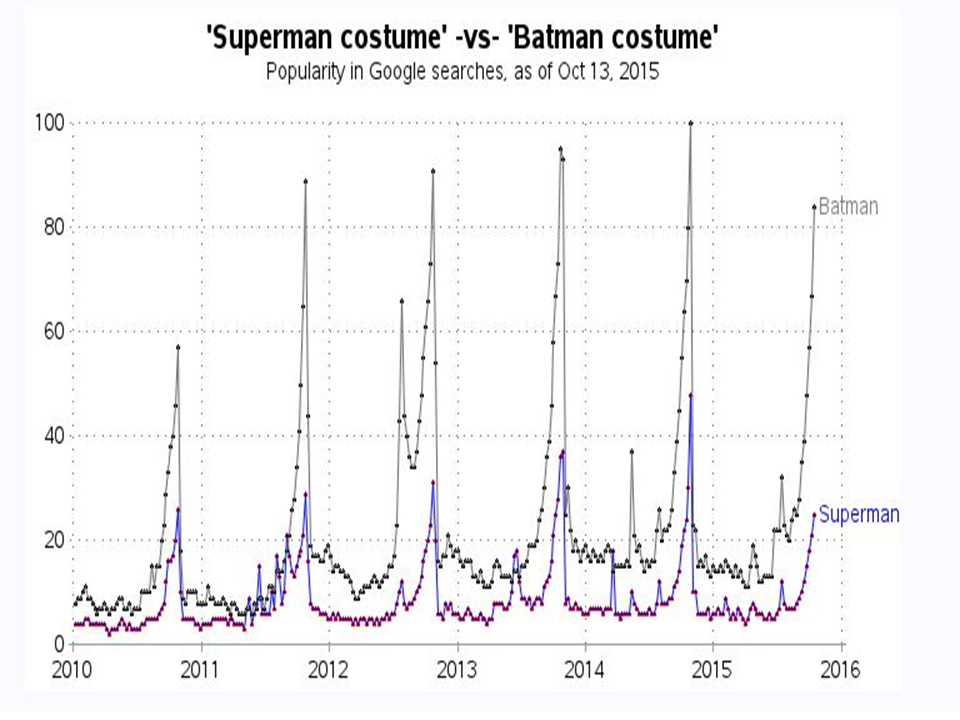
So, the winner of the most preferred Halloween costume is – Batman!
That was our analysis of Superman vs. Batman costumes for Halloween; feel free to share what your favourite Halloween costume would be… the Walking Dead or good old Dracula?
Looks like India is slowly welcoming other foreign holiday trends into their own with time, thus it is evident that as a country we love to party whatever may be the occasion!
Interested in a career in Data Analyst?
To learn more about Machine Learning Using Python and Spark – click here.
To learn more about Data Analyst with Advanced excel course – click here.
To learn more about Data Analyst with SAS Course – click here.
To learn more about Data Analyst with R Course – click here.
To learn more about Big Data Course – click here.