Clustering is used to make sense of large volumes of data, structured or unstructured, by dividing the data into groups. The members of a group are ‘’similar’’ between them and ‘’dissimilar’’ to objects in other groups. The similarity is based on characteristics such as equal distances from a point or people who read the same genre of book. These groups with similar members are called clusters. The various methods of clustering, which we shall be discussing subsequently, help break up data into logical groupings before analyzing the data more deeply.
If a CEO of a company presents a broad question like- ‘’ Help me understand our customers better so that we can improve marketing strategies’’, then the first thing analysts need to do is use clustering methods to the classify customers. Clustering has plenty of application in our daily lives. Some of the domains where clustering is used are:
- Marketing: Used to group customers having similar interests or showing identical behavior from large databases of customer data, which contain information on their past buying activities and properties.
- Libraries: Used to organize books.
- Biology: Used to classify flora and fauna based on their features.
- Medical science: Used for the classification of various diseases.
- City-planning: identifying and grouping houses based on house type, value and geographical location.
- Earthquake studies: clustering existing earthquake epicenters to locate dangerous zones.
Clustering can be performed by various methods, as shown in the diagram below:
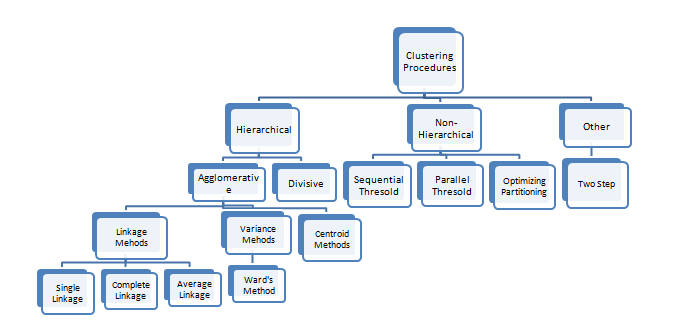 Fig 1
Fig 1
The two major techniques used to perform clustering are:
- Hierarchical Clustering: Hierarchical clustering seeks to develop a hierarchy of clusters. The two main techniques used for hierarchical clustering are:
- Agglomerative: This is a ‘’bottom up’’ approach where first each observation is assigned a cluster of its own, then pairs of clusters are merged as one moves up the hierarchy. The process terminates when only a single cluster is left.
- Divisive: This is a ‘’top down’’ approach wherein all observations start in one cluster, and splits are performed recursively as one moves down the hierarchy. The process terminates when each observation has been assigned a separate cluster.
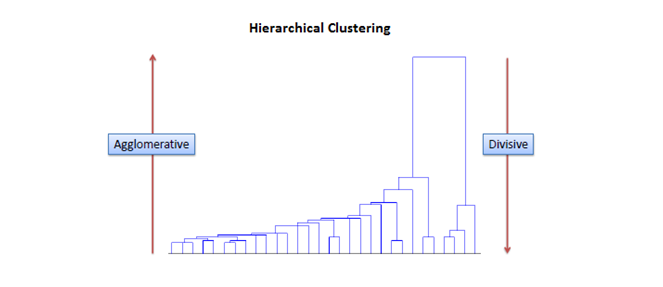
Fig 2: Agglomerative clustering follows a bottom-up approach while divisive clustering follows a top-down approach.
- Partitional Clustering: In partitional clustering a set of observations is divided into non-overlapping subsets, such that each observation is in exactly one subset. The main partitional clustering method is K-Means Clustering.
The most popular metric used for forming clusters or deciding the closeness of clusters is distance. There are various distance measures. All observations are measured using one particular distance measure and the observation having the minimum distance from a cluster is assigned to it. The different distance measures are:
- Euclidean Distance: This is the most common distance measure of all. It is given by the formula:
Distance((x, y), (a, b)) = √(x – a)² + (y – b)²
For example, the Euclidean distance between points (2, -1) and (-2, 2) is found to be
Distance((2, -1), (-2, 2)) 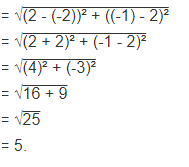
- Manhattan Distance:
This gives the distance between two points measured along axes at right angles. In a plane with p1 at (x1, y1) and p2 at (x2, y2), Manhattan distance is |x1 – x2| + |y1 – y2|.
- Hamming Distance:
Hamming distance between two vectors is the number of bits we must change to convert one into the other. For example, to find the distance between vectors 01101010 and 11011011, we observe that they differ in 4 places. So, the Hamming distance d(01101010, 11011011) = 4
- Minkowski Distance:
The Minkowski distance between two variables X and Y is defined as
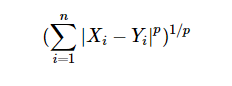
The case where p = 1 is equivalent to the Manhattan distance and the case where p = 2 is equivalent to the Euclidean distance.
These distance measures are used to measure the closeness of clusters in hierarchical clustering.
In the next blogs, we will discuss the different methods of clustering in more details, so make sure you follow DexLab Analytics– we provide the best big data Hadoop certification in Gurgaon. Do check our data analyst courses in Gurgaon.
Interested in a career in Data Analyst?
To learn more about Data Analyst with Advanced excel course – Enrol Now.
To learn more about Data Analyst with R Course – Enrol Now.
To learn more about Big Data Course – Enrol Now.To learn more about Machine Learning Using Python and Spark – Enrol Now.
To learn more about Data Analyst with SAS Course – Enrol Now.
To learn more about Data Analyst with Apache Spark Course – Enrol Now.
To learn more about Data Analyst with Market Risk Analytics and Modelling Course – Enrol Now.