No two dashboards are similar. They cater to different audiences, serves distinct purposes, and address individual problems as unique as you.

In this blog post, we will talk about the 5 best practices to apply right now to create attractive dashboards, and engage users effectively.
For world-class data analytics courses in Pune, click on DexLab Analytics.
Be influenced, artistically
Be a true artist. Austin Kleon, the notable author of Steal Like an Artist asks us to get inspired by others. Even it holds true for dashboards; while designing dashboards indulge in a creative endeavor. Take inspiration from various sources and chalk out something incredible.
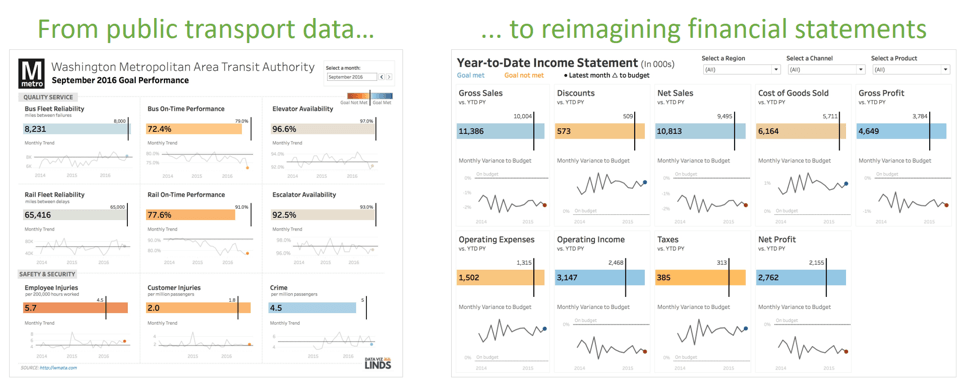
If any visualization catches your attention, observe it closely and jot down the attributes that would benefit your own project.
De-clutter is the word
When you start with creating dashboards, it’s obvious to throw up as many graphs and charts as you possibly can. But, beware, never fall into this trap. Going minimalistic is today’s mantra to swear by.
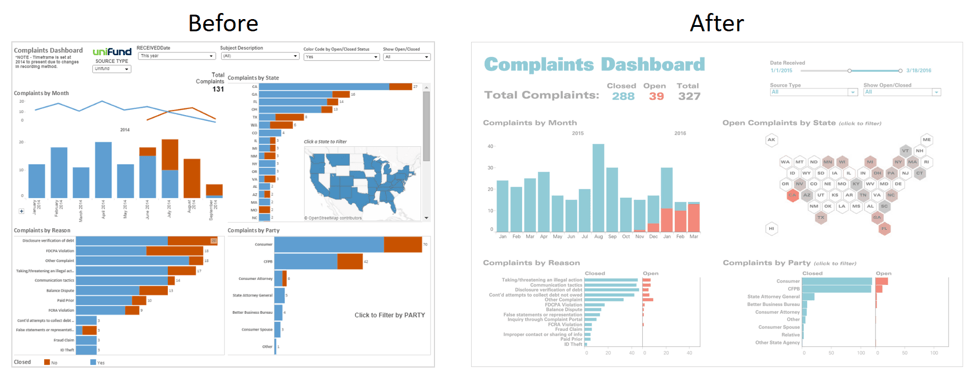
Start removing unnecessary installations from your dashboard, so that your users’ get to see what you best offer. This is often called an iterative process – a better version of your work is discovered the more time you spent looking at the dashboard.
Typography matters
A right font size is important. At times, it becomes tempting to use as many font types and sizes as we like but it won’t do any good. Instead, it is advisable to stick to a clear hierarchy in terms of typography.
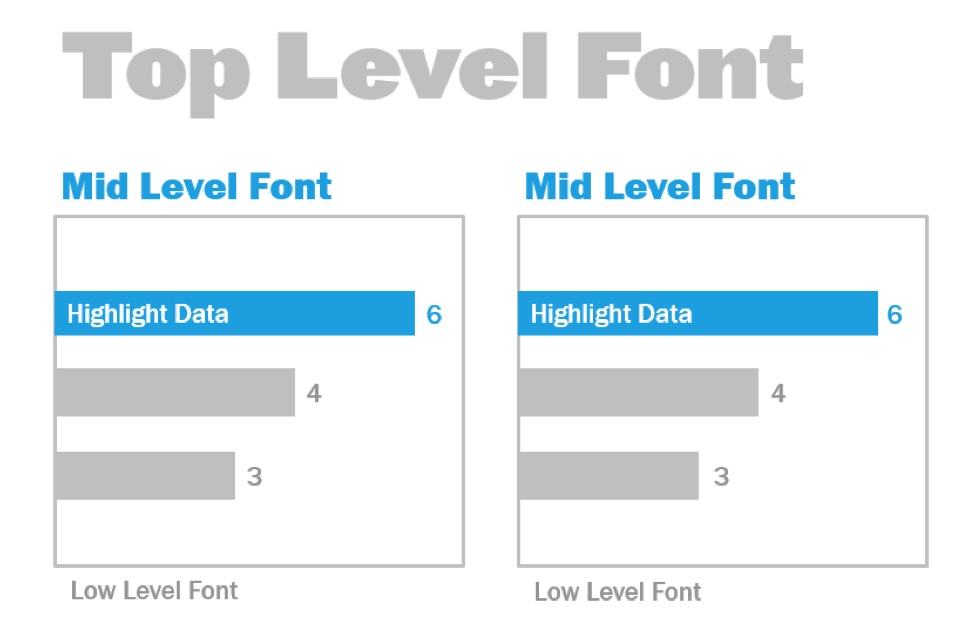
In this illustration, there are three different font sizes – top, mid and low. The middle-level font is blue in color to drag user’s attention. Colors grab eyeballs; hence it is the best way to attract viewers.
Prudent use of colors
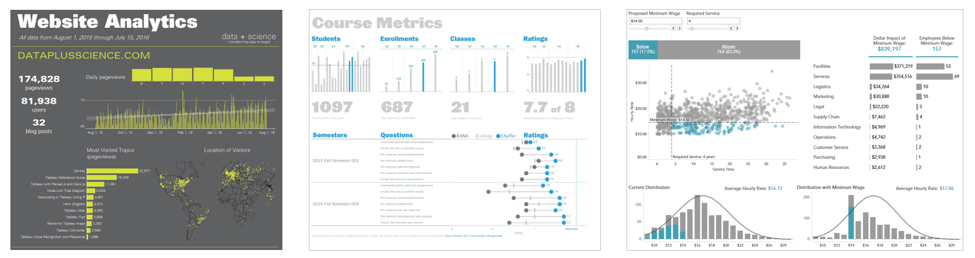
Colors add value while creating a dashboard. But overuse of anything is detrimental; don’t make your dashboard look like an accident caused in a paint shop. Colors are productive, but you should be able to justify the deliberate use of colors on your dashboard – what is the use of choosing this particular color? What does it try to communicate to the users? If you have no answers here, then just bid goodbye to the color.
Use a grid layout
A grid format can never go wrong, when designing a dashboard (filters, titles, views, etc.). Grids score high on ensuring some clarity to a dashboard. It helps in providing a reading order to your viewers, guiding them through the dashboard in the most logical way. The grid can be either column or row-based, depending on your choice and purpose.
True to the nature, dashboards need to be crisp and simple. But alas, no dashboard can be 100% perfect the first time. With time and effort, data representation and visualization gets better. The criticisms attracted help you inculcate fresh perspectives in your visualization, making your data viz a complete stand-out. A majority of dashboards goes through many iterations, and for good. Even today, qualified Dashboards experts are leaving no stone unturned to improve data representations, while adapting to altering business equations.
Feeling confused from where to start? Enroll for Tableau certification Pune. Join DexLab Analytics and give a push to your career in Tableau BI.
Sources: Tableau.com
Interested in a career in Data Analyst?
To learn more about Machine Learning Using Python and Spark – click here.
To learn more about Data Analyst with Advanced excel course – click here.
To learn more about Data Analyst with SAS Course – click here.
To learn more about Data Analyst with R Course – click here.
To learn more about Big Data Course – click here.
Tableau, Tableau BI Certification, tableau certification, tableau course details, tableau training in pune, tableau training institute