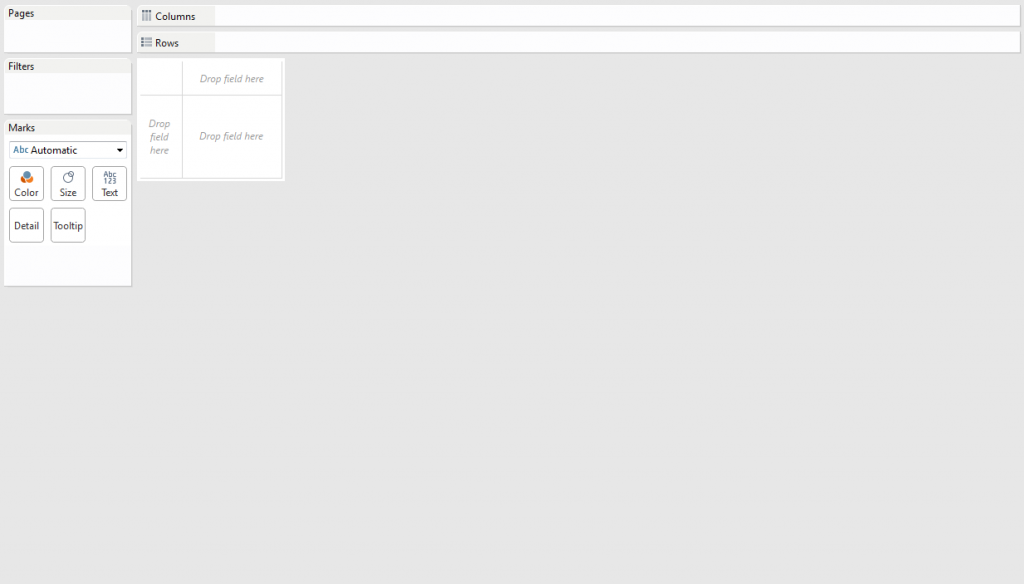
Do you experience vizzer’s block? Do you feel paralyzed by choices? Do you stare at the blank Tableau canvas, wondering from where to start your viz?
Though brimming with stories to tell, you are stuck at the get-go. Fortunately, here are a few tricks to help you get over the blank-canvas woes and get yourself rolling.
Draw your mind out
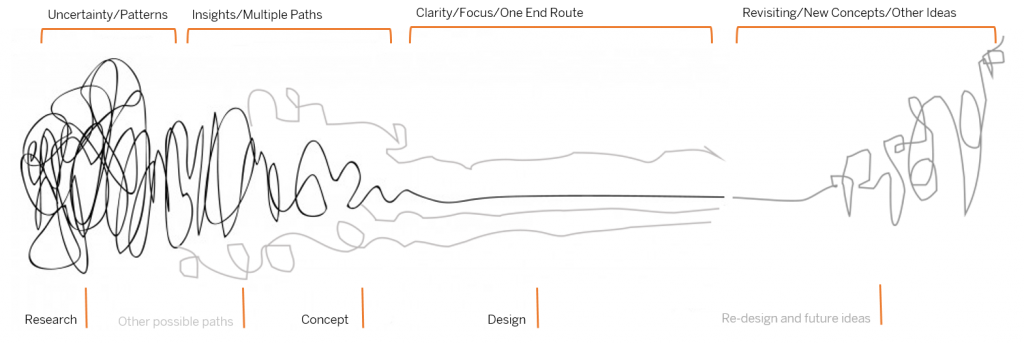
Doodling does help! Draw, doodle or sketch, just kick-start your cognitive thinking abilities. The scribbles don’t need to be pretty or legible, but they have to spur the creative process. So, grab a paper and pen, and start brainstorming.
And, you don’t have to go it alone. From academic researchers and lifestyle bloggers to professional visual consultants, the entire world is drawing.
Get inspired by ace visualizers
People inspire you, or they drain you – pick them wisely. Keep the right people by your side, they will lift you up and get the better out of you. Be in association with hotshot vizzes, follow maven data journalists and data vizzers, jot down notes and read data-viz pdfs.
ALWAYS, keep your eyes open to stumble across fetching viz, whose idea might work out well for you!
For example, this visualization by Washington Post tells a gripping food-survey story.
Develop a formidable structure to understand the data better
Frazzled about starting your viz? If affirmative, then this checklist can save your day. It is segregated into two parts – data preparation and data exploration.
Taking the first one first, i.e. Data Preparation:
As boring as it sounds, physical inspection of your data sometimes helps you comprehend the data set’s possibilities and challenges. To draw a clearer picture, here are few things to look into a data set:
- The kind of data in each field
- The pattern of data structure and format
- Fields covered and not covered by the data set
- Highest and lowest values in each field
- Are there fields that contain null values
If you follow the above example, you will find there are multiple levels of data infused in the food-survey data set – where some food items boasts of four sub-categories, while others has only two. Situations like this make it hard to establish a comparison between two food items unless you know that they are at their minimum sub-category.
Coming to the second one, Data Analysis:
Analyse a data set just like interviewing it. Whenever you feel like going blank by staring at a Tableau canvas, start grilling yourself about data. Do it in a traditional interview way and you are sorted.
- What, how, who, why, when, and where – Evaluate each field and ponder how to apply these questions on each field.
- Let your inner child smile, while you ask “Why? Why? Why?” to your data.
To pop colours on your blank-canvas, interviewing is indispensable.
Remember: Every end is a new beginning
What if my final viz fails to shed light upon the deepest cognizance? Or, how will I feel if my viz cannot do justice to my story. Don’t worry, pondering is common. Get up and hit the road. There are countless number of ways to address a viz and remember that once you finish a viz, it doesn’t mean an end. Remaking and telling stories in newer and innovative ways are something you can always look up to anytime.
Turn the volume up and focus
Crank up the music, boost productivity and tune out distractions! Music helps in focusing on work, by diminishing outside noise (phone buzzing, colleagues chatting, TV blasting). Irrespective of the kind of tunes you like, plug in your headphones and say goodbye to the world!
Recently, tableau bi training courses are gaining a lot of attention. If you are seeking comprehensive tableau certification delhi, scroll through DexLab Analytics.
Interested in a career in Data Analyst?
To learn more about Data Analyst with Advanced excel course – Enrol Now.
To learn more about Data Analyst with R Course – Enrol Now.
To learn more about Big Data Course – Enrol Now.To learn more about Machine Learning Using Python and Spark – Enrol Now.
To learn more about Data Analyst with SAS Course – Enrol Now.
To learn more about Data Analyst with Apache Spark Course – Enrol Now.
To learn more about Data Analyst with Market Risk Analytics and Modelling Course – Enrol Now.
Tableau BI Certification, tableau certification, tableau certification delhi, tableau course details, tableau training institute


